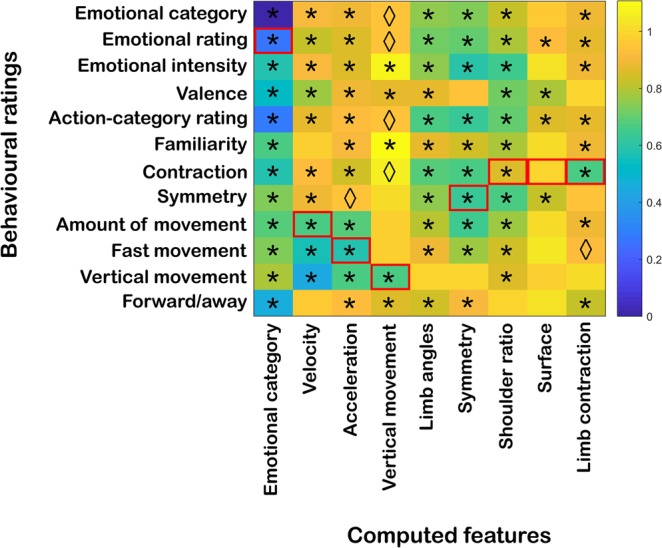
Figure 8.

Average Spearman’s rank correlation between the behavioural-rating RDMs and the RDMs of the computed features. Distances are indicated in 1-Spearman’s correlation values, with blue indicating strong similarity and yellow strong dissimilarity between behavioural and computed features. Asterisks and rhombi below the diagonal indicate significant correlations after Bonferroni correction and correlations that presented significant uncorrected p-values, respectively (αbonf = 0.05/12, with 12 comparisons per behavioural rating; see Table SR4 in Supplementary Results). Red boxes indicate the correspondence between computed features and behavioural ratings.
