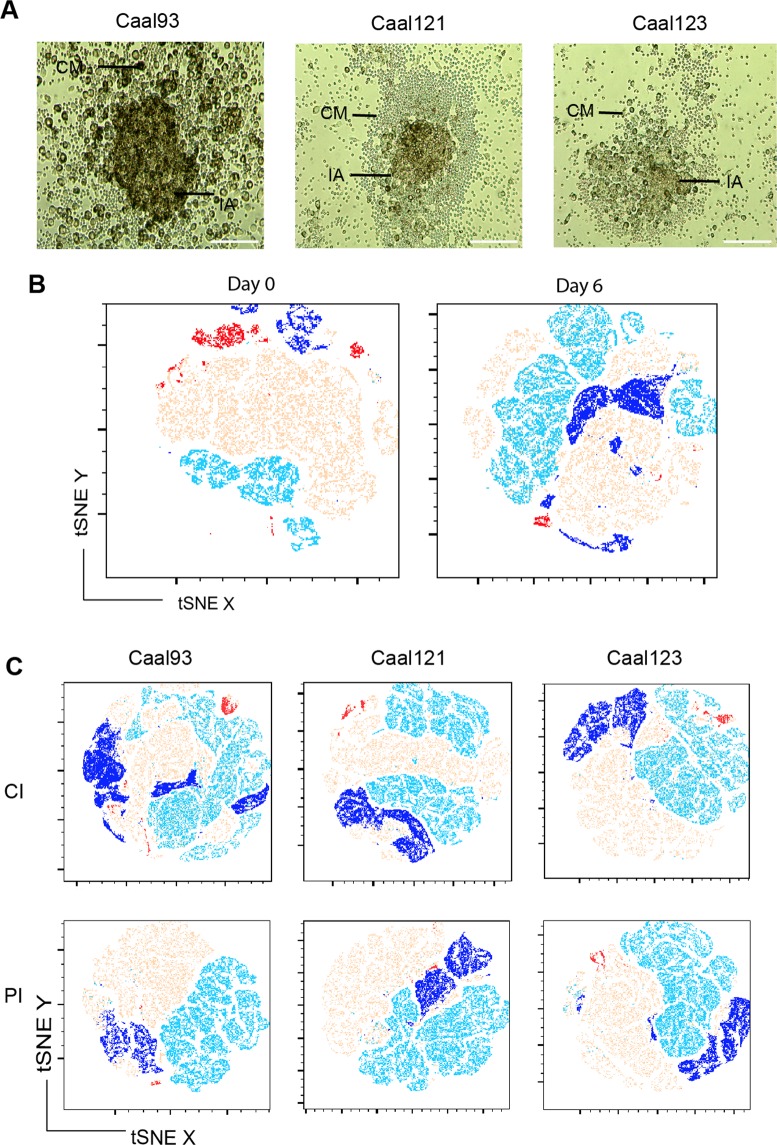
Figure 3.
Phenotypic variations of human immune cells after C. albicans challenge. (A) Representative C. albicans immune-aggregates by light microscopy observation showing cell migration gradients (CM) and compact inflammatory aggregates (IA) 6 days after challenge with Caal93, Caal121 and Caal123 clinical isolates. Bars represent 50 μm. (B) Phenotypic modification of immune cells induced by C. albicans. Flow cytometry data from each subject over the three months period was concatenated and analyzed on tSNE FlowJo module. Representative unsupervised tSNE clustering of immune cells for one subject before (day 0) and after C. albicans challenge (day 6) showing phenotypic clustering of CD66+ (beige), CD14+ (red), CD4+ (light blue), CD8+ (dark blue) immune cells (n = 16). (C) tSNE phenotypic signatures induced in immune cells after challenge by Caal93, Caal121 and Caal123 clinical isolates according to CI outcome (fungal burdens lower than 100 CFU/ ml by day 6) and PI outcome (fungal burdens higher than 100 CFU/ ml by day 6). CD66+ (beige), CD14+ (red), CD4+ (light blue), CD8+ (dark blue) immune cells (n = 16).

