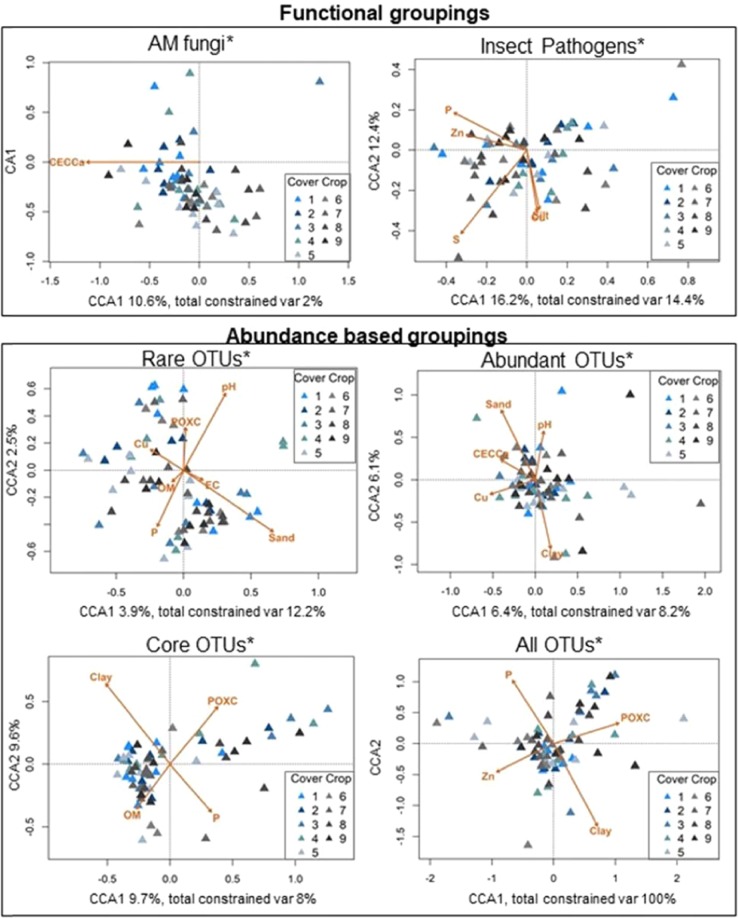
Figure 5.
Constrained ordination plots using CCA models of OTU groupings. Important environmental variables selected using forward and backwards selection. (Supplementary Table 6). Each model that significantly explained the species dispersion across the OTU groupings are denoted with an *. Lengths of each vector indicate the correlation between the variable and the ordination. Percentages next to CCA1/CCA2 represent the amount of inertia explained by the axes, while total constrained var represents the amount of inertia accounted for by the vectors (environmental variables).

