Figure 3.
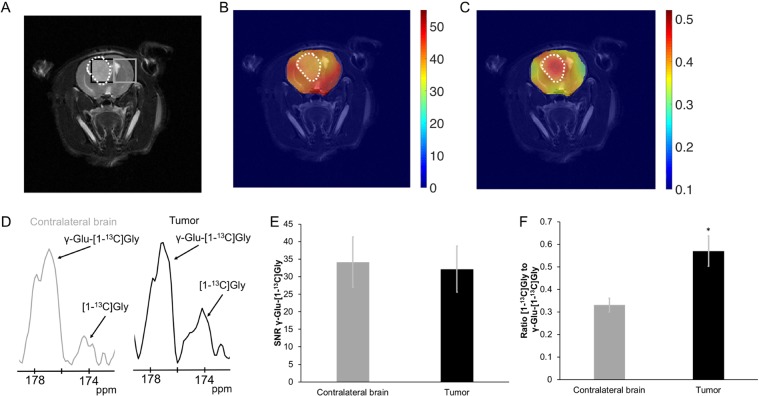
Representative HP 13C imaging acquired at 3T. (A) Representative T2-weighted anatomical image from a tumor-bearing animal. (B) Heat map of γ-glutamyl-[1-13C]glycine (γ-Glu-[1-13C]Gly) SNR illustrating homogeneous distribution of substrate in the brain. (C) Heat maps of the ratio of maximum [1-13C]glycine ([1-13C]Gly) to maximum γ-Glu-[1-13C]Gly showing that metabolism in the tumor region is higher than in normal brain. White dotted line outlines the tumor. (D) Representative spectra collected from contralateral brain (gray) and tumor (black) voxels. (E) Quantification of γ-Glu-[1-13C]Gly SNR. γ-Glu-[1-13C]Gly SNR in normal brain and tumor values are 34.1 ± 7.2 a.u. and 32.1 ± 6.6 a.u. respectively. (F) [1-13C]Gly-to-γ-Glu-[1-13C]Gly ratios: 0.33 ± 0.03 a.u. vs 0.57 ± 0.07 a.u. for normal-appearing brain and tumor respectively. Gray: Contralateral brain; Black: Tumor. Animals per group = 4. *p < 0.05.

