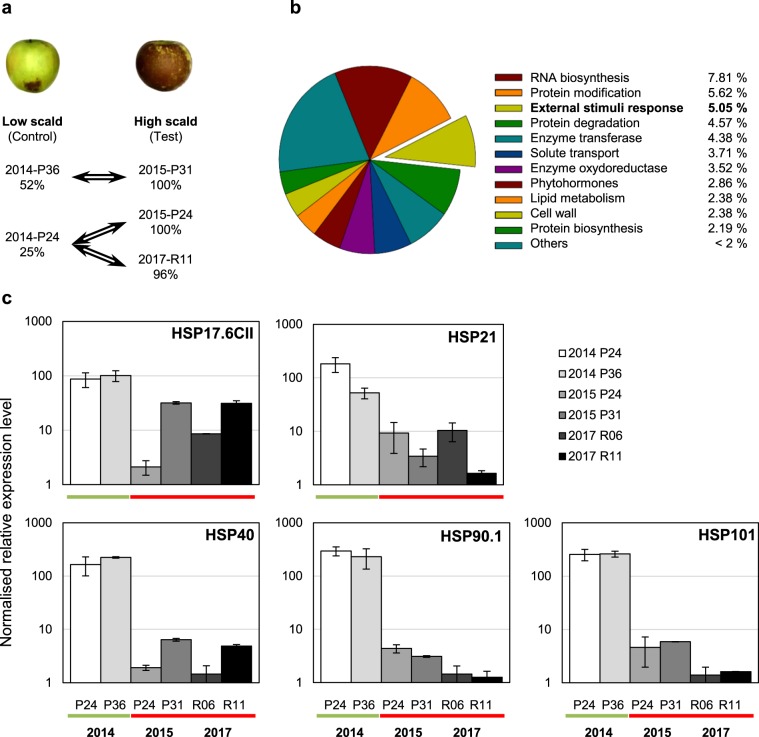
Figure 3.
Transcriptomic analysis at harvest for fruit batches with contrasted phenotype for superficial scald. (a) Three comparisons were setup in dye-swap between peel samples collected at early harvest from fruit batches with “low” versus “high” scald incidence after cold storage and shelf-life. The three comparisons were combined in one statistical analysis setting the “low” scald samples as “control”, and “high” scald samples as “test”. (b) DETs assignment to functional categories: 1050 DETs with BH < 0.05 were selected and 57% were assigned (based on Mapman ontology using the Mercator web tool). (c) Relative gene expression level (RT-qPCR) in fruit peel samples collected at harvest from “low” (2014) or “high” (2015 and 2017) scald years for HSP17.6CII (MD15G1053800), HSP21 (MD13G1108500), HSP40 (MD10G1289200), HSP90.1 (MD01G1208700) and HSP101 (MD06G1201600). Data are mean values ± SD of n = 3.

