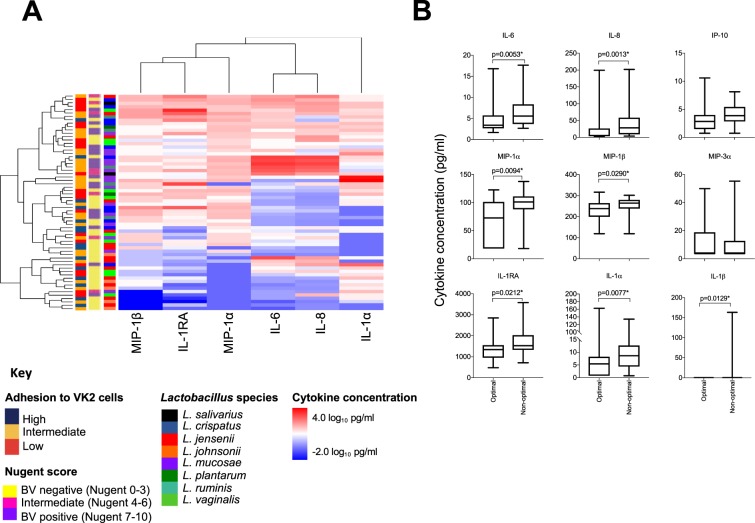
Figure 1.
Cytokine production by vaginal epithelial (VK2) cells in response to vaginal Lactobacillus isolates. (A) Heatmap of log10-transformed concentrations of cytokines produced by VK2 cells stimulated with Lactobacillus isolates (n = 64) obtained from women with optimal (n = 36), intermediate (n = 8) and non-optimal microbiota (n = 20). Lactobacillus cultures were adjusted to 4.18 × 10⁶ colony forming units (CFU)/ml in antibiotic free keratinocyte serum free media then added to VK2 cell monolayers before being incubated for 24 hours at 37 °C with 5% CO2. Cytokine concentrations in the cell culture supernatants were measured using Luminex. Level of adhesion to VK2 cells, bacterial vaginosis (BV) status, and Lactobacillus species are also shown on the left side of the heatmap. (B) Inflammatory cytokine production in response to Lactobacillus isolates from women with optimal microbiota (Nugent 0–3; n = 36), including L. crispatus (n = 6); L. jensenii (n = 12), L. johnsonii (n = 5), L. mucosae (n = 4), L. plantarum (n = 1), L. vaginalis (n = 8), compared to women with non-optimal microbiota (Nugent 4–10; n = 28), including L. crispatus (n = 5), L. jensenii (n = 2), L. mucosae (n = 11), L. plantarum (n = 1), L. ruminis (n = 5), L. salivarius (n = 2) and L. vaginalis (n = 2). Data are shown as Tukey box plots. Boxes represent the interquartile ranges, lines within boxes represent medians and whiskers represent minimum and maximum values. P-values were adjusted for multiple comparisons using a false discovery rate step down procedure. *Adjusted p-values < 0.05 were considered statistically significant.

