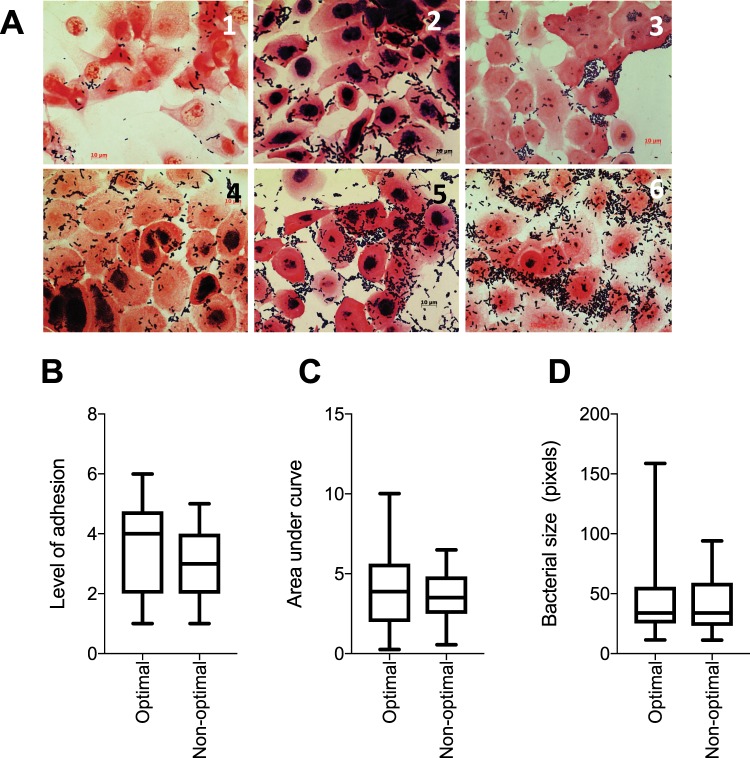
Figure 4.
(A) Gram stained images of Lactobacillus adhesion to VK2 cells. Lactobacillus isolates (n = 64) were cultured and adjusted to 4.18 × 10⁶ colony forming units (CFU)/ml in antibiotic free keratinocyte serum free media before being added to VK2 cell monolayers in chamber slides and incubated for 2 hours at 37 °C with 5% CO2. Non-adherent bacteria were removed with sterile phosphate buffered saline (PBS) before the slides were Gram stained. Representative images of the Gram stained slides were collected and Lactobacillus isolates were ranked according to level of adhesion in ascending order from least adherent (1) to the most adherent (6). Level of adhesion to VK2 cells, growth rates and lengths of Lactobacillus isolates obtained from women with optimal [Nugent score: 0–3 (n = 36)] and non-optimal microbiota [Nugent score: 4–10 (n = 28)]. (B) Adhesion was determined by adding Lactobacillus cultures adjusted to 4.18 × 10⁶ colony forming units (CFU)/ml in antibiotic free keratinocyte serum free media to VK2 cell monolayers and incubating for 2 hours at 37 °C with 5% CO2. Non-adherent bacteria were removed with sterile phosphate buffered saline (PBS) before the slides were Gram stained. Each isolate was then scored according to level of adhesion (1–6) by two individuals blinded to the cytokine profiles of the isolates. (C) Growth rates were evaluated by measuring the optical densities at a wavelength of 600 nm, of Lactobacillus cultures initially adjusted to 4.18 × 10⁶ CFU/ml and incubated in de Man Rogosa and Sharpe (MRS) broth anaerobically for 24 hours. The areas under the curve were determined during the active phase of growth. (D) Relative bacterial size. Single colonies were picked from Lactobacillus cultures (n = 64) and smears were prepared on microscope slides and Gram-stained before taking images at 1,000x magnification. Bacterial length was determined from the images using Image J software. The mean of five measurements for each isolate was used for analysis. Boxes represent the interquartile ranges, lines within boxes represent medians and whiskers represent minimum and maximum values. P-values < 0.05 were considered statistically significant.

