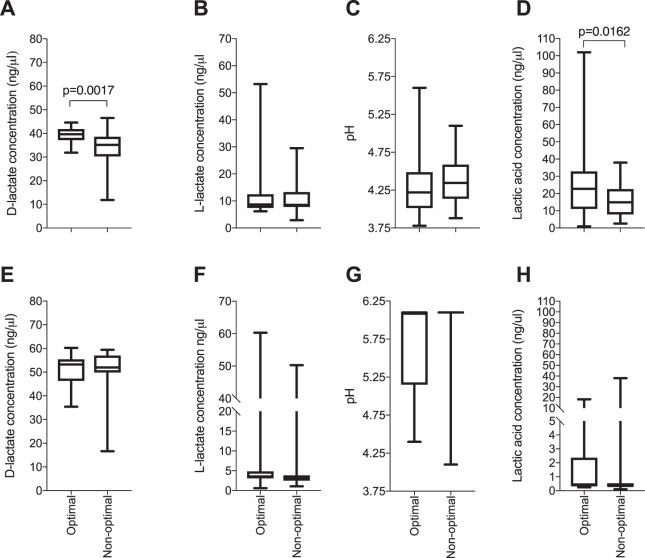
Figure 5.
Comparison of D-lactate production, L-lactate production, culture acidification and total lactic acid production by clinical Lactobacillus isolates in bacterial cultures. (A–D) Characteristics in de Man Rogosa and Sharpe (MRS) culture; (E–H) Characteristics in Lactobacillus-VK2 cell co-cultures. Lactobacillus isolates obtained from women with optimal (n = 36) and non-optimal microbiota (n = 28) were cultured and adjusted to 4.18 × 10⁶ colony forming units (CFU)/ml in MRS broth and incubated anaerobically for 24 hours, or adjusted to 4.18 × 10⁶ CFU/ml in antibiotic free keratinocyte serum free media before being added to VK2 cell monolayers and incubated for 24 hours at 37 °C under 5% CO2. Supernatants were collected and the concentrations of D-lactate, L-lactate were determined using D-Lactate Colorimetric and Lactate Assay kits. Culture pH was measured using a pH meter in bacterial cultures and pH strips in cell co-cultures. Total lactic acid was calculated using the Henderson-Hasselbalch equation. Boxes represent the interquartile ranges, lines within boxes represent medians and whiskers represent minimum and maximum values. P-values < 0.05 were considered statistically significant.

