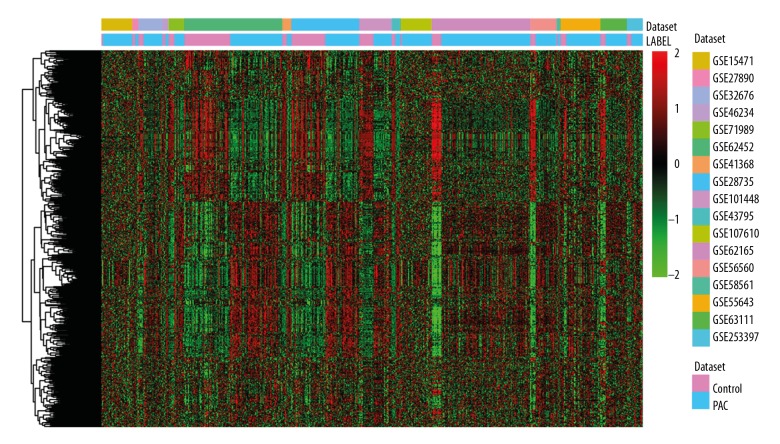
Figure 1.
Hierarchical clustering analysis of DEGs between PAC and non-tumor controls. Row and column represented DEGs and tissue samples, respectively. The color scale indicated the expression of DEGs while red and green color represented upregulation and downregulation, respectively. DEGs – differentially expressed genes; PAC – pancreatic cancer.

