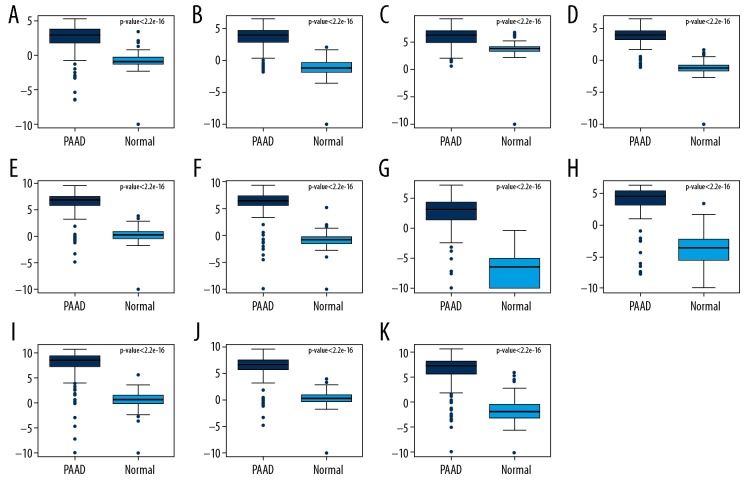
Figure 5.
Cross-validation of DEGs by TCGA and GTEx Box-plot displayed the expression levels of DEGs between PAAD and non-tumor tissues. (A) AHNAK2; (B) CDH3; (C) IFI27; (D) ITGA2; (E) LAMB3; (F) SFN; (G) SLC6A14; (H) TMPRSS4; (I) CEACAM6; (J) LAMC2; (K) S100P. The x-axis represents PAAD and normal groups. The y-axis represents relative gene expression levels. DEGs – differentially expressed genes; TCGA – The Cancer Genome Atlas; GTEx – Genotype-Tissue Expression; PAAD – pancreatic adenocarcinoma.

