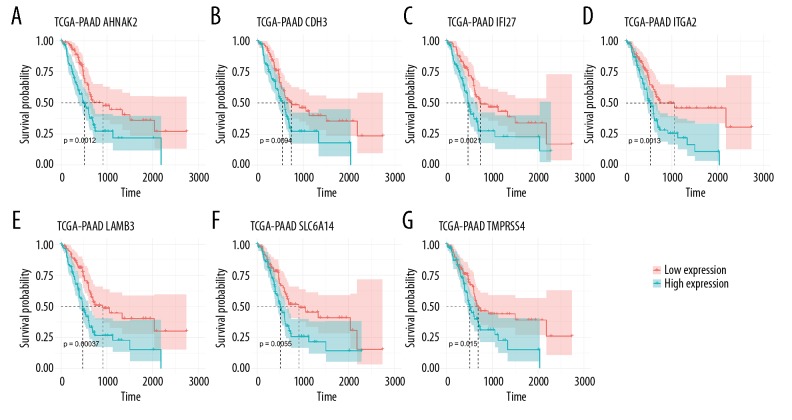
Figure 6.
Survival analysis of DEGs with great prognostic value for PAC. (A) AHNAK2; (B) CDH3; (C) IFI27; (D) ITGA2; (E) LAMB3; (F) SLC6A14; (G) TMPRSS4. The x-axis indicates times (days) and y-axis indicates survival rate. High expression of these eight DEGs was significantly associated with lower survival rate in patients with PAC. DEGs – differentially expressed genes; PAC – pancreatic cancer.

