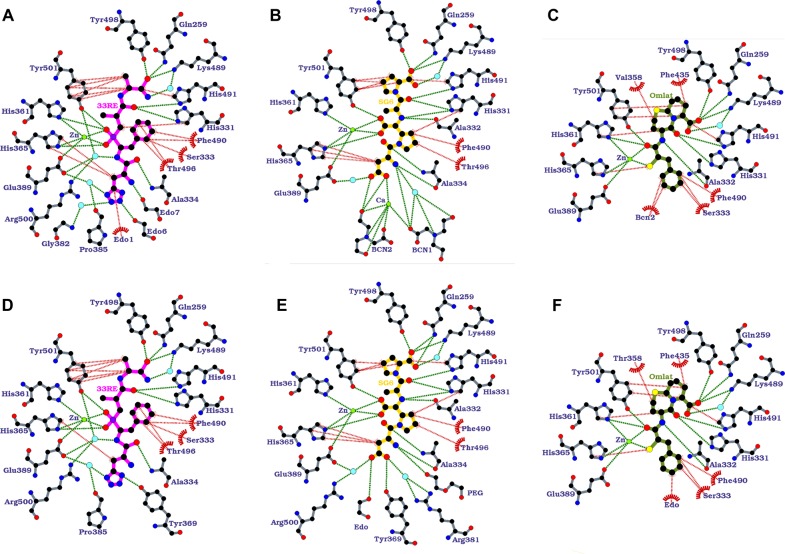
Figure 6. Ligplot representations of inhibitor binding interactions.
Comparison of (A) 33RE, (B) SG6 and (C) Omapatrilat bound to N389-S2_S′-nACE, with (D) 33RE (PDB 4BXK), (E) SG6 (PDB 6EN5) and (F) Omapatrilat (PDB 6H5X) wild-type N389-nACE complexes. H-bond/electrostatic and hydrophobic interactions are shown as green and red dashed lines, respectively, water molecules as cyan spheres, and red, semi-circular symbols depict residues solely involved in hydrophobic interactions.

