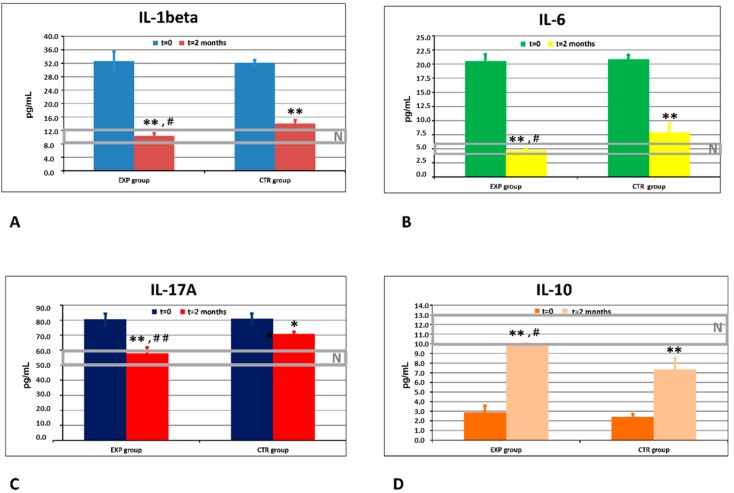
Figure 2.
Effects of ETP and CTP on inflammatory cytokines in gingival crevicular fluid (GCF). (A) Dynamics of cytokine IL-1beta (pg/mL) in the experimental (EXP) and control (CTR) groups of patients. N: normal range of values obtained in healthy people. ** p < 0.01 vs. baseline values; # p < 0.05 vs. CTR. (B) Dynamics of cytokine IL-6 (pg/mL) in the experimental (EXP) and control (CTR) groups of patients. N: normal range of values obtained in healthy people. ** p < 0.01 vs. baseline values; # p < 0.05 vs. CTR. (C) Dynamics of cytokine IL-17A (pg/mL) in the experimental (EXP) and control (CTR) groups of patients. N: normal range of values obtained in healthy people. * p < 0.05 vs. baseline values; ** p < 0.01 vs. background values; ## p < 0.01 vs. CTR. (D) Dynamics of cytokine IL-10 (pg/mL) in the experimental (EXP) and control (CTR) groups of patients. N: normal range of values obtained in healthy people. ** p < 0.01 vs. baseline values; # p < 0.05 vs. CTR.

