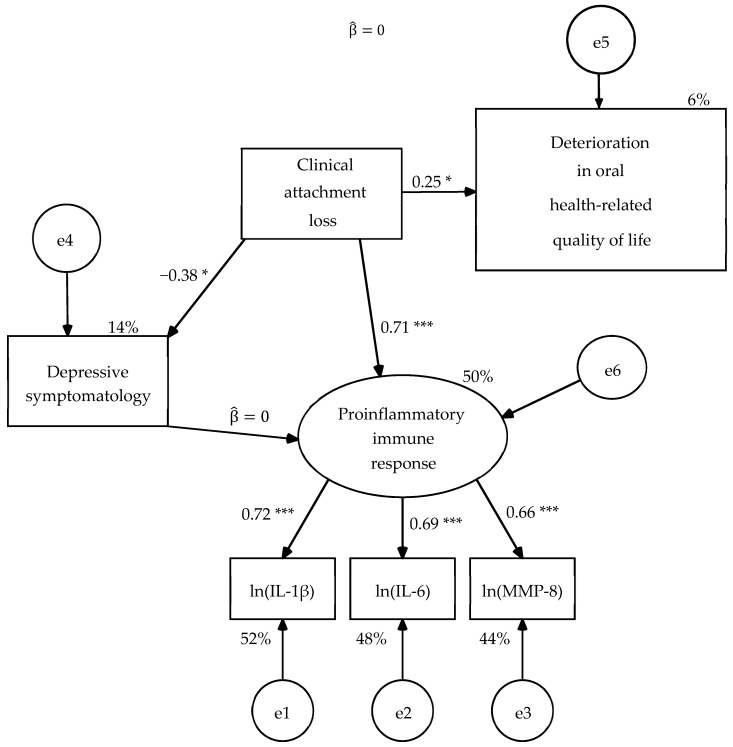
Figure 3.
Second revision of hypothetical model (R2) with constraints on measurement residuals (MR) estimated in the sample of 34 dental patients. Estimation method: Maximum likelihood. Average variance extracted (AVE) = 0.477 and McDonald’s coefficient ω = 0.732 for the measurement model. Probability value under condition of the null hypothesis was true (H0: β = 0) at a two-tailed test: * p ≤ 0.05, p ≤ 0.01, *** p ≤ 0.001. ln(IL-1β) = Napierian logarithm of salivary interleukin 1 beta concentration, ln(IL-6) = Napierian logarithm of salivary interleukin 6 concentration, ln(MMP-8) = Napierian logarithm of salivary matrix metalloproteinase-8 concentration, and e = measurement or structural error.

