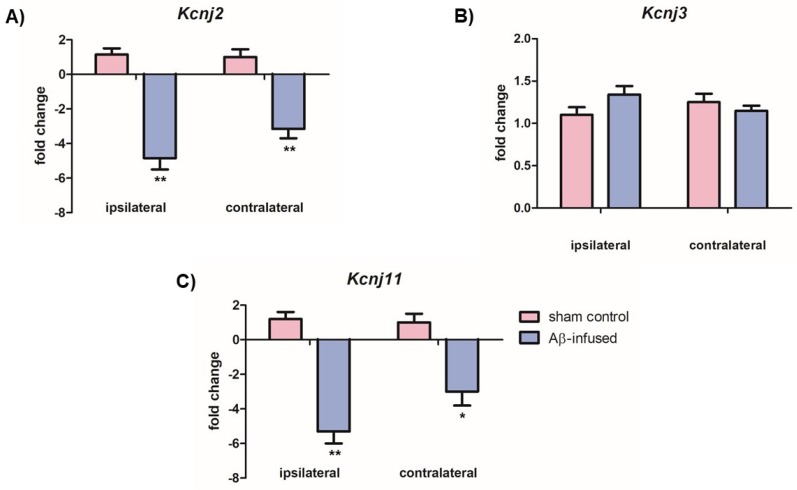
Figure 3.
Relative mRNA levels of (A) Kcnj2 (Kir2.1), (B) Kcnj3 (Kir3.1), and (C) Kcnj11 (Kir6.2) in ipsilateral and contralateral hippocampi from both sham control and Aβ(1–42)-infused rat model. Data are expressed as fold change of mRNA levels normalized to the housekeeping control gene (Gapdh) and represent the mean ± SEM obtained in 3 independent experiments, n = 7 for each group, * p < 0.05, ** p < 0.01.

