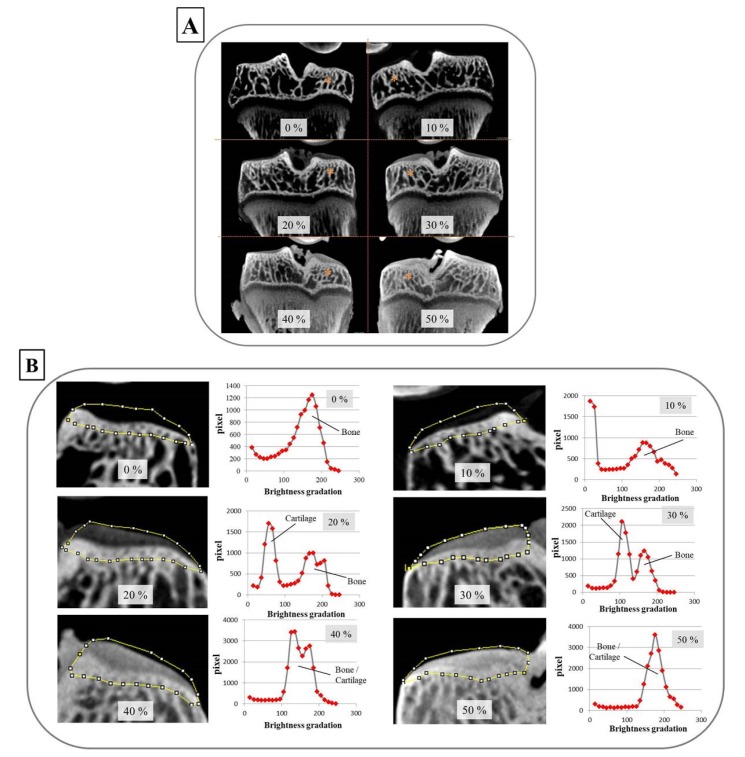
Figure 2.
The optimal concentration of Oypalomin for CEX-μCT was 30%. (A) The overall image of tibia frontal sections with the indicated concentrations (%) of Oypalomin. Staining of the articular cartilage of the tibial plateau was dependent on the Oypalomin concentrations. The asterisks indicate the medial tibial condyle. (B) Brightness measurements reflected X-ray absorptions of the articular cartilage and subchondral bone. The regions of interest (ROIs) surrounded by the yellow line were determined manually. Brightness and pixels within the ROI are plotted as histograms. The optimal concentration of Oypalomin to differentiate cartilage and bone was 30%.

