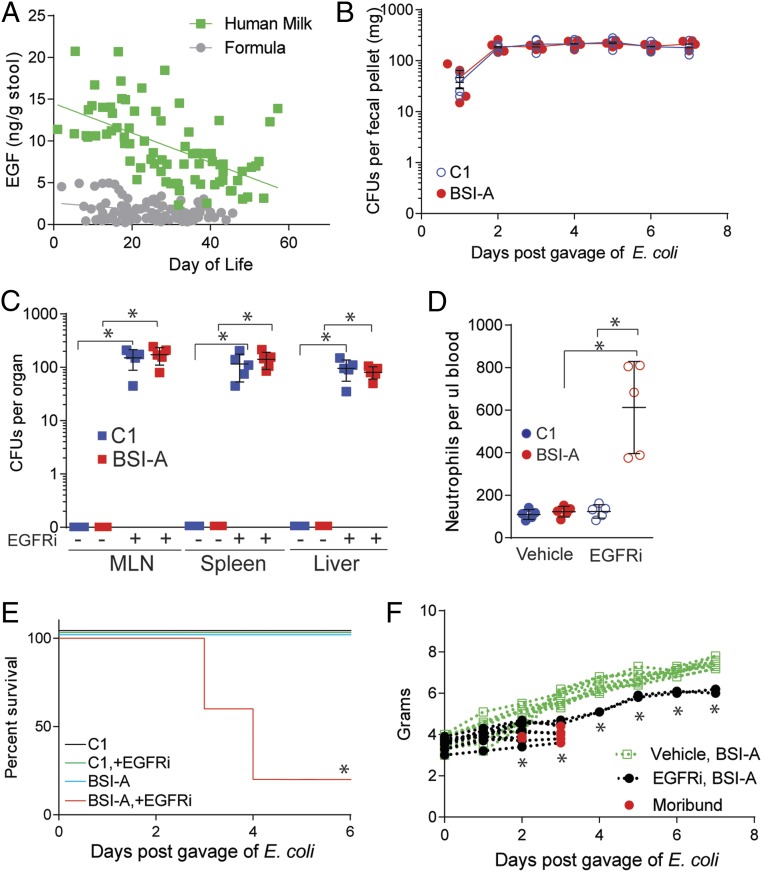
Fig. 1.
Inhibition of EGFR results in bacterial translocation of gut-residing E. coli. (A) Concentration of EGF as measured by ELISA from the stool of children fed mother’s own milk (green squares) or formula (gray circles). In B–F, conventionally reared mice were gavaged with 2 × 10⁵ CFUs of E. coli and injected with EGFRi on DOL5. (B) CFUs in stool following gavage of 2 × 10⁵ CFUs of E. coli C1nalR (blue) or BSI-AnalR (red) in conventionally reared mice on DOL5. (C) CFUs in mesenteric lymph node (MLN), spleen, and liver 3 d following gavage of 2 × 10⁵ CFUs of E. coli C1nalR (blue) or BSI-AnalR (red) on DOL5 in conventionally reared mice injected with tyrphostin AG1478 (EGFRi) or vehicle. (D) Neutrophils in the blood 48 h following gavage of 2 × 10⁵ CFUs of E. coli C1nalR or E. coli BSI-AnalR and injected with EGFRi as indicated or vehicle. (E) Survival of mice following vehicle or EGFRi injection and gavage of 2 × 10⁵ CFUs of E. coli C1nalR or BSI-AnalR. (F) Weight of mice following gavage of 2 × 10⁵ CFUs of E. coli BSI-AnalR and injected with EGFRi (black), or vehicle (green). Red dots denote moribund pups. n = 5 individuals in each group with multiple time points in A. n = 5 mice per group in B–D. n = 15 mice per group from 3 independent litters in E. n = 10 mice per group in F. Individual data points plotted in B–D with mean and SD plotted per group. Statistics used: Linear regression (A), Mann–Whitney (C), one-way ANOVA (D), two-way ANOVA (F), Kaplan–Meier (E), *denotes statistical significance, P < 0.05 or less.

