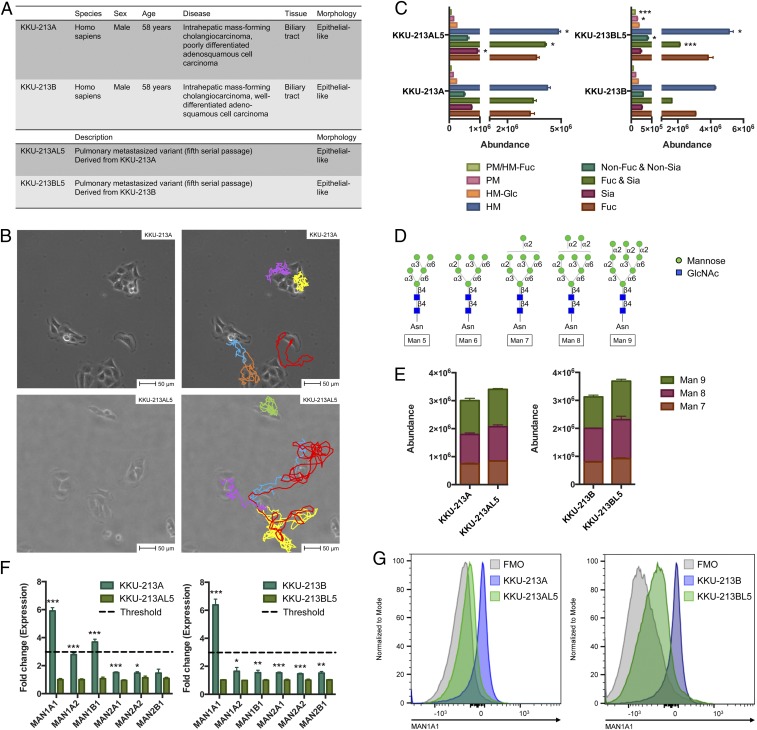
Fig. 1.
Analysis of parental and metastatic CCA cell surface glycosylation. (A) Morphological and phenotypic characterization of CCA cells. (B) Image capture of live cell microscopy videos of KKU-213A and KKU-213AL5 growth at the beginning of a 24-h incubation at 37 °C. Per given cell, displacement was tracked frame by frame. Colored lines (Right) indicate the direction and extent of each cell’s movement. (Scale bars, 50 μm.) (C) Quantitative changes in N-glycan abundances between parental and metastatic CCA cells based on their compositional features. Groups include high mannose (HM), paucimannose (PM), fucosylated (Fuc), sialylated (Sia), and nondecorated (non-Fuc and non-Sia). Data are represented as mean ± SEM (n = 3); *P < 0.05; ***P < 0.001. (D) Structures of high-mannose N-glycans found in mammalian cells, represented using symbol nomenclature. (E) Abundances of extended high-mannose glycan structures (Man 7 to Man 9) in parental and metastatic CCA cells. Data are represented as mean ± SEM (n = 3). (F) Fold change of glycosylation-related gene expression (normalized to parental) measured by qRT-PCR. Data are represented as mean ± SEM (n = 3); *P < 0.05; **P < 0.01; ***P < 0.001. (G) Intracellular binding of anti-MAN1A1 in parental and metastatic CCA cells, detected by flow cytometry. FMO, fluorescence minus one.

