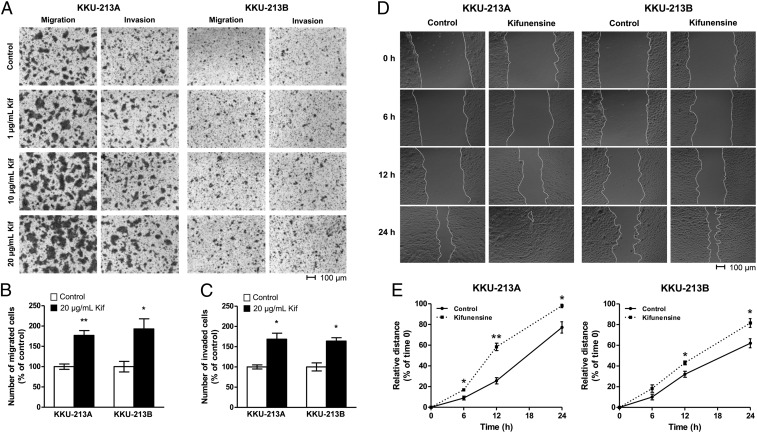
Fig. 2.
Enhancement of metastatic phenotypes exhibited by kifunensine-treated parental CCA cells. (A) Microscope images of cells that passed through an uncoated (migration) or Matrigel-coated (invasion) microporous polycarbonate membrane under increasing concentrations of kifunensine (Kif). Cells were stained with crystal violet before imaging. (Scale bars, 100 μm.) (B and C) Number of kifunensine-treated (20 μg/mL) cells that migrated or invaded in comparison to untreated counterparts. Data are represented as mean ± SEM (n = 3); *P < 0.05; **P < 0.01. (D) The extent to which a scratch wound was closed by untreated or treated cells over time. (Scale bars, 100 μm.) (E) Percentage of closure is presented as a measure that is relative to the distance of the wound at t = 0. Data are represented as mean ± SEM (n = 3); *P < 0.05; **P < 0.01.

