Fig. 7.
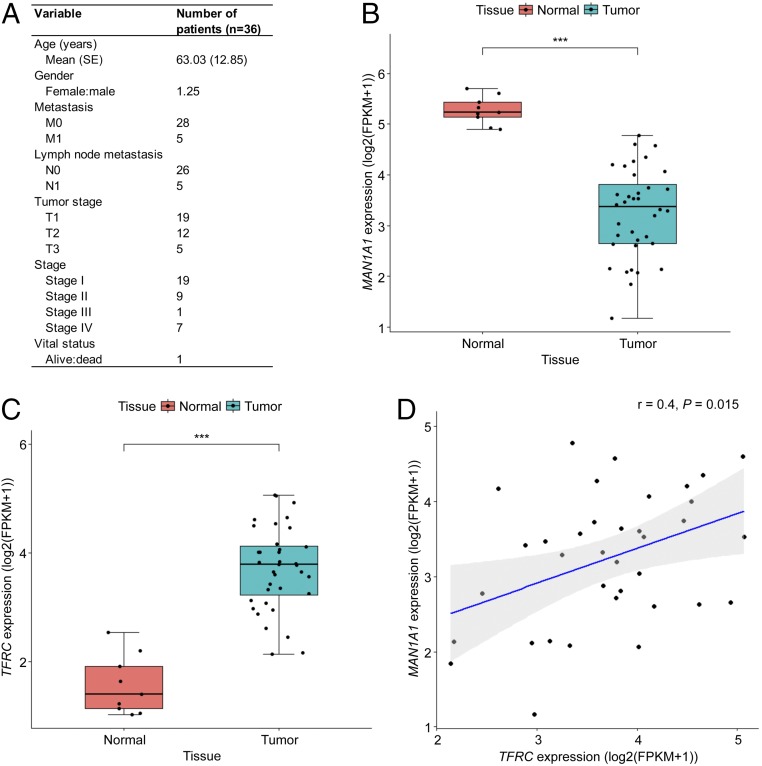
Expression of MAN1A1 and TFRC in human CCA tissues. (A) Clinical characteristics of patients with primary tumor in the TCGA-CHOL cohort. (B and C) Box plots of MAN1A1 and TFRC expression in CCA tissues (n = 36) and matched normal adjacent tissues (n = 9). FPKM, fragments per kilobase million; ***P < 0.001. (D) Correlation scatter plot of MAN1A1 and TFRC expression in normal and CCA tissues. r, Pearson correlation coefficient.

