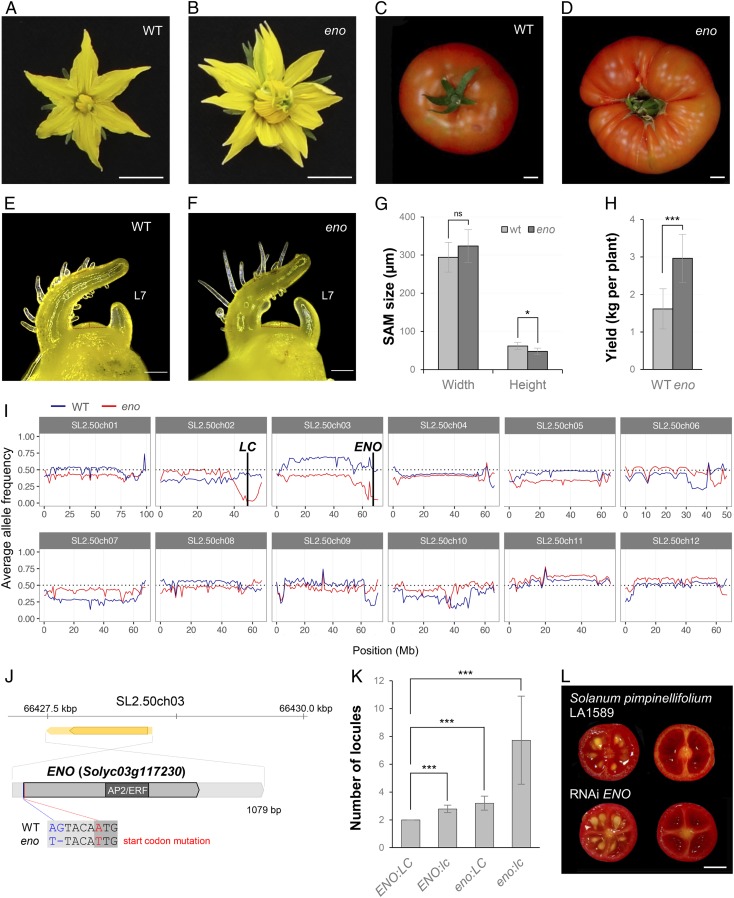
Fig. 1.
Characterization and cloning of the eno mutant. Representative flower (A and B) and fruit (C and D) of wild-type (WT) and eno mutant plants. Images of the SAM from WT (E) and eno (F) plants at the transition meristem stage, before forming the first floral bud (L7, leaf 7). (G) Quantification of SAM size from WT and eno plants. (H) Yield performance of WT and eno plants. (I) Distribution of the average allele frequency of WT (blue line) and eno (red line) pools grouped by chromosomes. (J) Positional cloning of the ENO gene (coding and UTRs in dark and light gray, respectively). The SNP mutation in the start codon of the ENO gene is marked in red, and the SNP and the InDel localized in its 5′ UTR region are shown in blue. (K) Number of locules for each genotyped class identified in the interspecific eno × LA1589 (S. pimpinellifolium) F2 mapping population. (L) RNAi-mediated knockdown of ENO gene in S. pimpinellifolium (accession LA1589). Data are means ± SD; n = 20 (G, H, and K). A two-tailed, two-sample Student’s t test was performed, and significant differences are represented by asterisks: ***P < 0.0001; *P < 0.01. ns, no statistically significant differences. (Scale bars, 1 cm [A–D and L] and 200 μm [E and F].)

