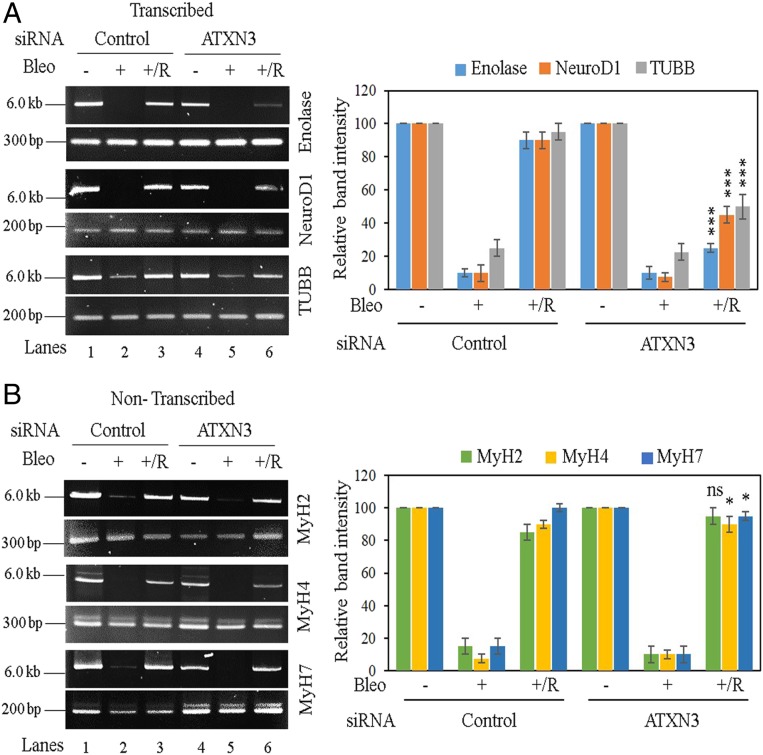
Fig. 2.
Evaluation of genomic strand-break levels in transcribed vs. nontranscribed genes in ATXN3-depleted cells by LA-qPCR. SH-SY5Y cells were transfected with either control siRNA (lanes 1 to 3) or ATXN3 siRNA (lanes 4 to 6) and further mock- (−) or Bleo- (+) treated or kept for recovery (+/R) after Bleo treatment. (Left) Representative agarose gel images of each long (6 to 8 kb) and short (∼200 to 400 bp) amplicon of (A) the transcribed (Enolase, NeuroD1, and TUBB) genes and (B) the nontranscribed (MyH2, MyH4, MyH7) genes. (Right) The bar diagrams represent the normalized relative band intensity compared to the control siRNA/mock-treated sample (lane 1) arbitrarily set as 100. n ≥ 3 in each case. Error bars represent ± SD of the mean. The persistence of damage after recovery for each transcribed gene (A, lane 6) was significant (***P < 0.005) compared to corresponding mock-treated samples (A, lane 4); however, the damage was almost completely repaired in nontranscribed genes (B, lane 6 vs. lane 4; ns, nonsignificant [P > 0.05]; *P < 0.05).

