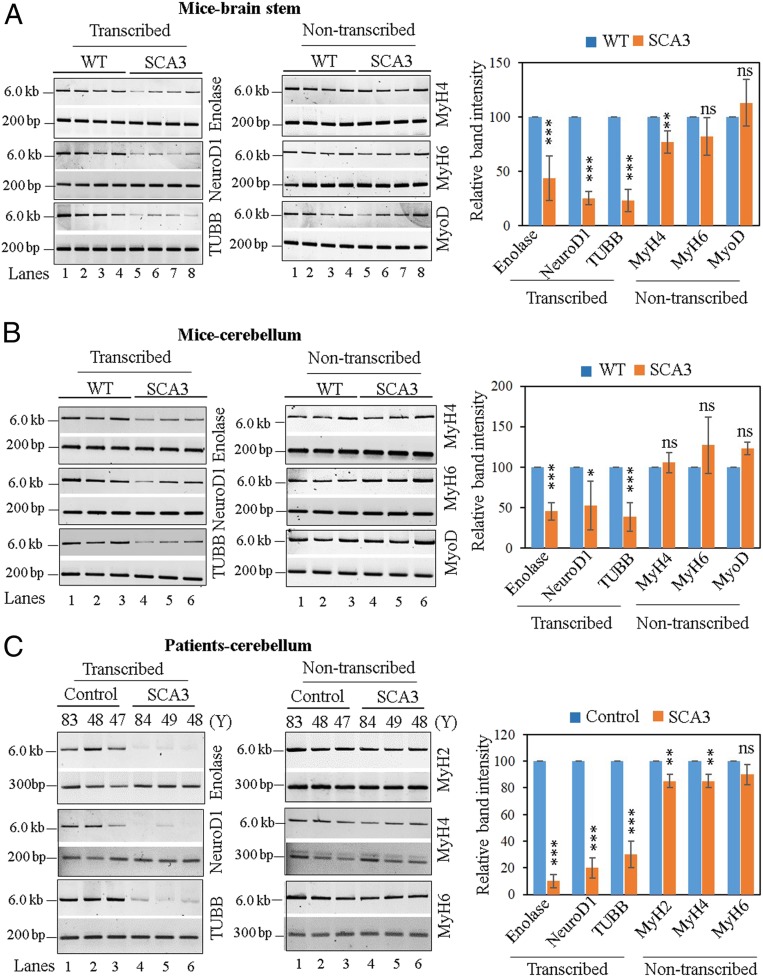
Fig. 5.
Evaluation of genomic strand-break levels in SCA3 mice and postmortem SCA3 patients’ brain. (Left) Representative agarose gel images of long (6 to 8 kb) and short (∼200 bp) amplicon of the corresponding transcribed (Enolase, NeuroD1, or TUBB) or nontranscribed (MyH2, MyH4, MyH6, or MyoD) genes from genomic DNA of (A) WT and SCA3 transgenic mice brainstem, (B) WT and SCA3 transgenic mice cerebellum, and (C) postmortem cerebellum of age-matched healthy normal (control) and SCA3 patients. (Right) The normalized relative band intensities are represented in the bar diagram with the WT/control sample arbitrarily set as 100 (n = 3, error bars represent ± SD of the mean). The damage accumulation for each transcribed gene in SCA3 mice/patients was significantly increased (***P < 0.005; *P < 0.05) compared to corresponding WT/control samples; however, there were far fewer DNA strand breaks in the nontranscribed genes (ns, nonsignificant [P > 0.05]; **P < 0.01).

