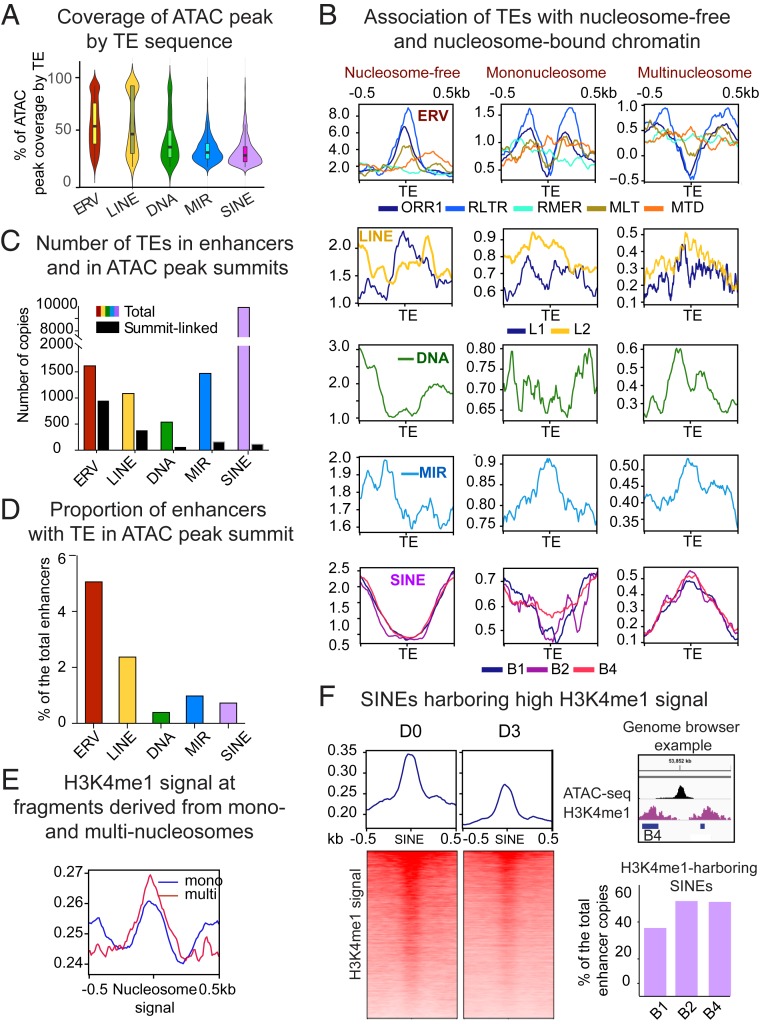
Fig. 3.
TEs enriched in CD8+ T cell enhancers differentially contribute to chromatin states. Related TE lineages are hierarchically grouped to produce. (A) Violin plot showing distribution of ATAC-peak coverage by TE sequence (percent of ATAC peak length composed of TE). Median values are indicated. (B) TE-centered coverage plots showing association of enhancer-enriched TEs with ATAC-seq fragments derived from nucleosome-free, mono-, or multinucleosomes (di- and trinucleosomal fragments are combined). (C) Bar plot showing total number of enriched TEs in enhancers (colored bars) and TEs overlapping with ATAC peak summits (black bars). (D) Bar plot showing proportion of enhancers with TE in ATAC-peak summit. (E) Coverage plot showing intensity of H3K4me1 signal (GSE95237 series) in ATAC sequencing fragments derived from mono- or multinucleosomes. (F, Left) Heatmaps representing bins per million mapped reads-normalized H3K4me1 signal plotted over enhancer-linked SINEs harboring higher reads, as compared to adjacent regions. (Upper Right) A genome browser example of the H3K4me1-loaded B4 SINE. Upper bar plot shows proportion of the most numerically abundant enhancer-enriched SINE species targeted by H3K4me1.

