Fig. 2.
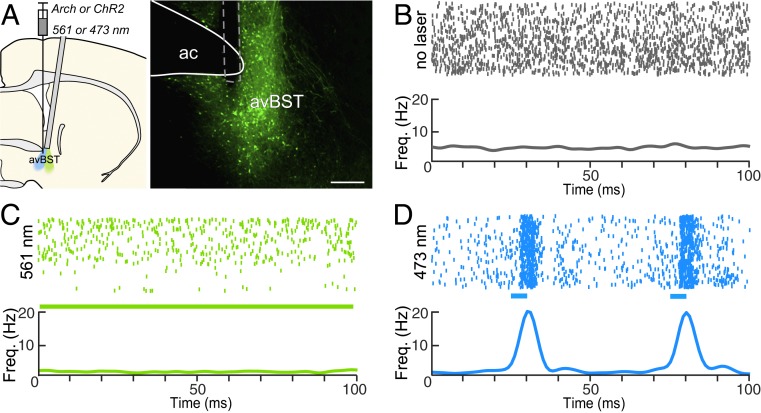
Characterization of avBST neuronal activity before and during optogenetic manipulations. (A) Schematic diagram (Left) illustrating AAV injection and optrode placement during the recording during inhibition and excitation (green and blue, respectively). Epifluorescent image (Right) displays an implant (dashed line) for neurophysiological activity recordings made ventral to the anterior commissure (ac). (Scale bar, 300 µm.) (B) Raster plot (Upper) and summary histogram (Lower) of action potentials over a 15-min recording session in the absence of illumination. (C) Raster plot (Upper) of action potentials in the same neuron as in B, in the presence of continuous 561-nm light over a 15-min recording session. The summary histogram (Lower) reveals a decrease in frequency relative to baseline activity above. (D) Raster plot (Upper) of action potentials in the presence of 20-Hz pulses of 473-nm light over a 15-min recording session, and summary histogram (Lower), illustrating light-evoked neuronal activity. Blue bars indicate 5-ms laser pulse.

