Fig. 6.
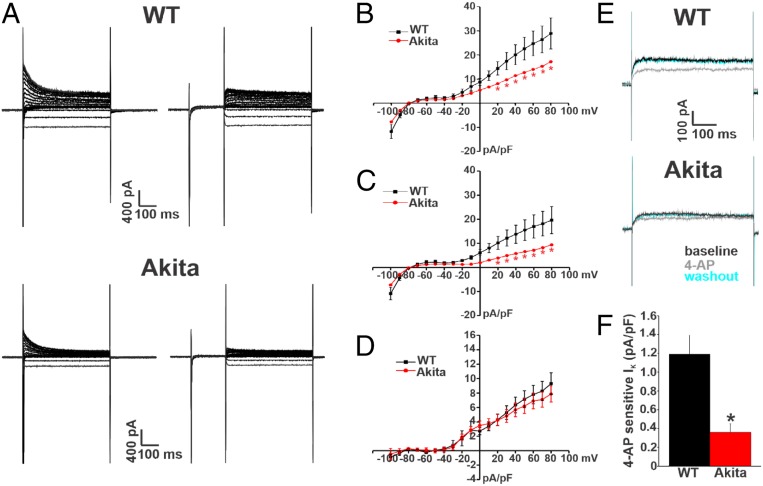
Repolarizing IK is reduced in right atrial myocytes in Akita mice. (A) Representative IK recordings in right atrial myocytes isolated from wild-type (WT) and Akita mice. The recordings on the left represent total IK measured between −100 and +80 mV. The recordings on the right represent IK measured between −100 and +80 mV following a prepulse to −40 mV to inactivate Ito. Cell capacitances for these representative recordings were 33 pF for the WT and 38 pF for Akita. (B) Summary IK IV curves measured at the peak of the IK recordings without the prepulse (recordings on the left in A) for right atrial myocytes isolated from WT and Akita mice. (C) Summary IK IV curves measured at the peak of the IK recordings with the prepulse (recordings on the right in A) for right atrial myocytes isolated from WT and Akita mice. *P 0.05 vs. the WT at each membrane potential by two-way repeated measures ANOVA with Tukey’s post hoc test. (D) Summary IK IV curves for the difference current between B and C, which is a measure of Ito. P = 0.85 for Ito density between the WT and Akita by two-way repeated measures ANOVA. For B–D, n = 19 WT and 16 Akita right atrial myocytes. (E) Representative IK recordings at +30 mV illustrating the effects of 4-AP (100 M), which inhibits Kv1.5-mediated IK, in right atrial myocytes from WT and Akita mice. (F) Summary data illustrating the amplitude of the 4-AP–sensitive IK in right atrial myocytes from WT and Akita mice. n = 9 WT and 10 Akita right atrial myocytes. *P 0.05 vs. the WT by Student’s t test. Current densities are measured in picoamperes/picofarad (pA/pF).

