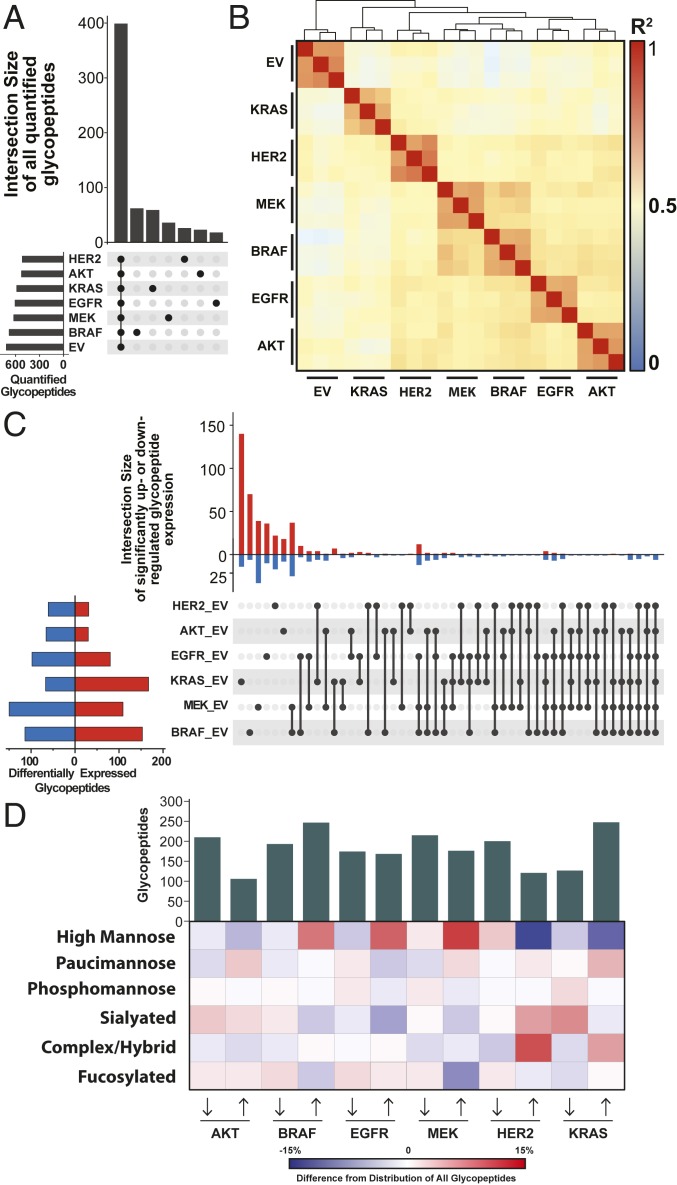
Fig. 5.
Quantitative glycopeptide measurements across mutant cell lines. (A) An UpSet plot shows glycopeptide identifications that are unique to or shared between datasets. (B) Pairwise Pearson correlations from all replicate analyses illustrate clustering between and glycoproteome. (C) An UpSet plot displays the shared and unique glycopeptides that are significantly differentially expressed upon oncogenic transformation (q < 0.05) as assessed by linear models for microarray data (LIMMA) with Bonferroni-adjusted P values. (D) A heatmap displays the differences in glycan type distribution for up- and down-regulated glycopeptides across cell lines.

