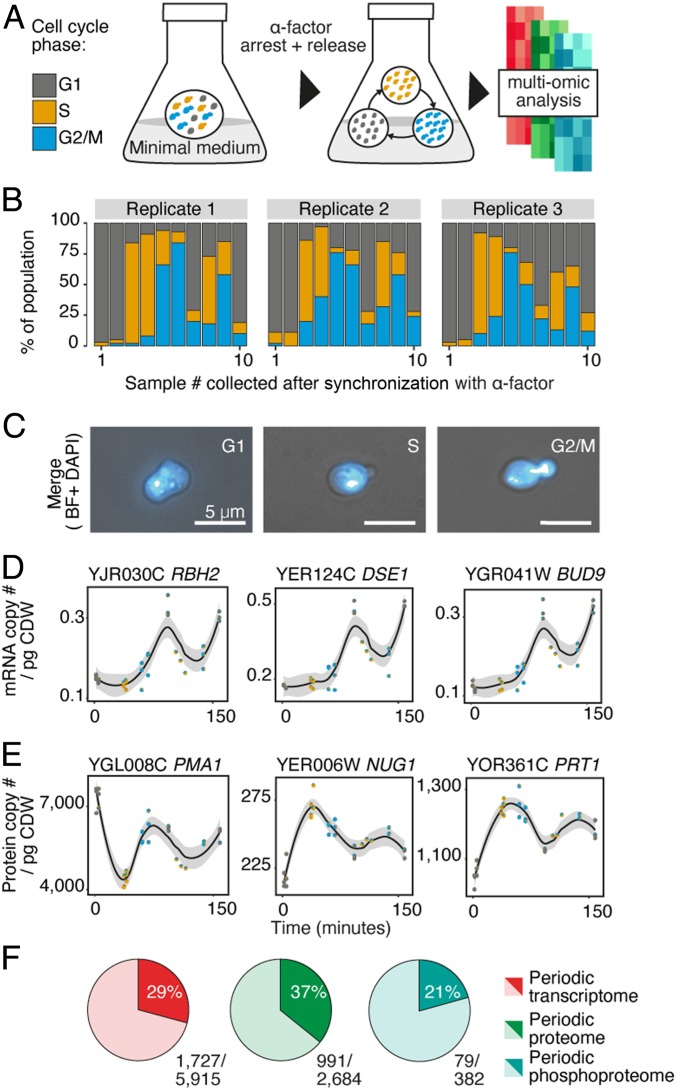
Fig. 1.
A quantitative multiomic perspective of the eukaryal cell cycle. (A) Experimental workflow of yeast synchronization with alpha (α)-factor mating pheromone. Samples were taken for up to three cell cycles in batch culture and submitted for absolute quantitative transcriptomics, proteomics, and semiabsolute quantitative phosphoproteomics and metabolomics. (B) Population composition for each sample following synchronization with α-factor. (C) Cells in G1: unbudded, S: budded (without DNA in daughter cell), and G2/M: mitotic cell cycle stages, identified using fluorescence microscopy and the DNA stain, 4′,6-diamidino-2-phenylindole. (Scale bar: 5 μm.) (D and E) Top-ranked periodic genes for the (D) transcriptome and (E) proteome identified by limma modeling. All biological replicates are plotted for each time point, with population composition for each sample represented in each point as a pie chart. Span for fitting each local regression, as part of the loess smoother (locally estimated scatterplot smoothing), is 0.6. CI for regression line is 95%. pg CDW, picogram of cell dry weight. (F) Fraction of each omic level identified by limma modeling to be periodic during the eukaryal cell cycle.

