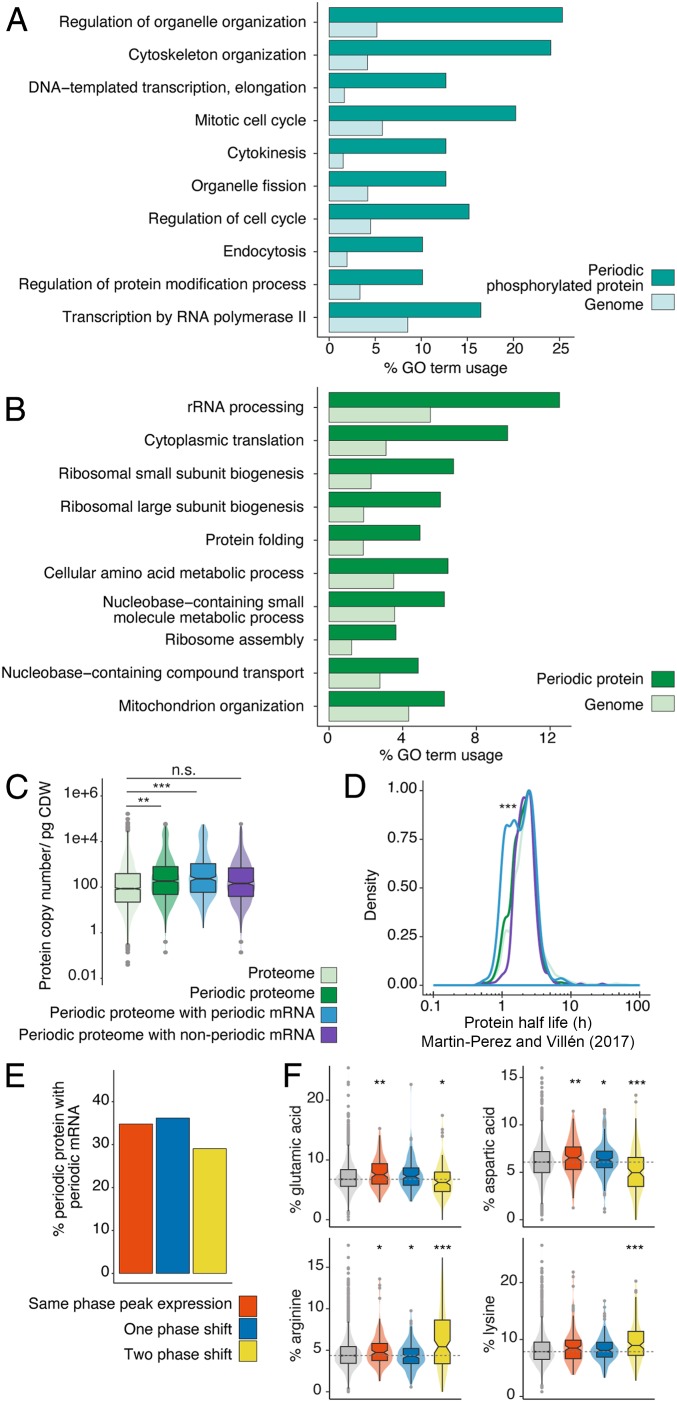
Fig. 2.
The periodic multiome reflects the demand of protein synthesis during division. (A and B) Biological process GO terms ranked by enrichment in the periodic (A) phosphoproteome and (B) proteome relative to the entire genome (all GO terms were mapped via Saccharomyces Genome Database GO Slim Term Mapper function [https://www.yeastgenome.org/goSlimMapper]). (C) Median abundance of proteins with or without periodic abundance, and, for periodic protein, those which also have or do not have periodic mRNA abundance. P values: *** ≤ 0.001; ** ≤ 0.01; n.s., not significant. pg CDW, picogram of cell dry weight. (D) Densities for the distribution of turnover values for protein groups in C, using half-life values from Martin-Perez and Villén (22), with density estimate scaled to a maximum of 1. P value: *** ≤ 0.001. (E) Percentage of periodic protein which has periodic mRNA binned according to the number of phase shifts between its expression peak and that of its mRNA. (F) Percentage of negative (Glu and Asp) and positive (Arg and Lys) amino acids in each protein for protein groups in E based on protein sequences taken from UniProt (https://www.uniprot.org). Percentage abundance is also shown in gray for all S. cerevisiae protein sequences available in UniProt (n = 6,721). Median percentage of amino acid abundances (Glu, Asp, Arg, or Lys) across all proteins is also highlighted by a horizontal dashed line. P values: *** ≤ 0.001; ** ≤ 0.01; * ≤ 0.05.

