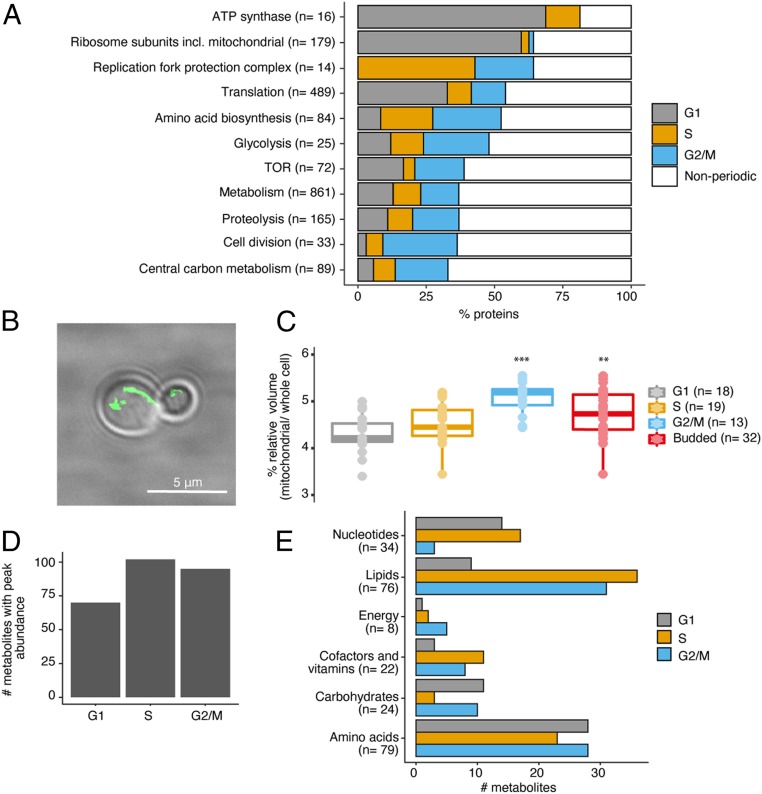
Fig. 3.
Biosynthetic processes act in synchrony with cell cycle phases. (A) Examples of biological processes with periodic protein that synchronize in peak abundance based on cell cycle phase. (B) Fluorescent-labeled mitochondrial network, using MitoLoc mitochondrial marker. (Scale bar: 5 μm.) (C) Mitochondrial volume relative to whole cell volume during each cell cycle phase. P values: *** ≤ 0.001; ** ≤ 0.01. (D) Number of metabolites with peak average abundance in each cell cycle phase (averages are based on replicates in G1, n = 12; S phase, n = 9; G2/M, n = 9). (E) Same as D with metabolites binned by superpathway. Annotation by Metabolon, Inc. was used as a reference for superpathway classification.

