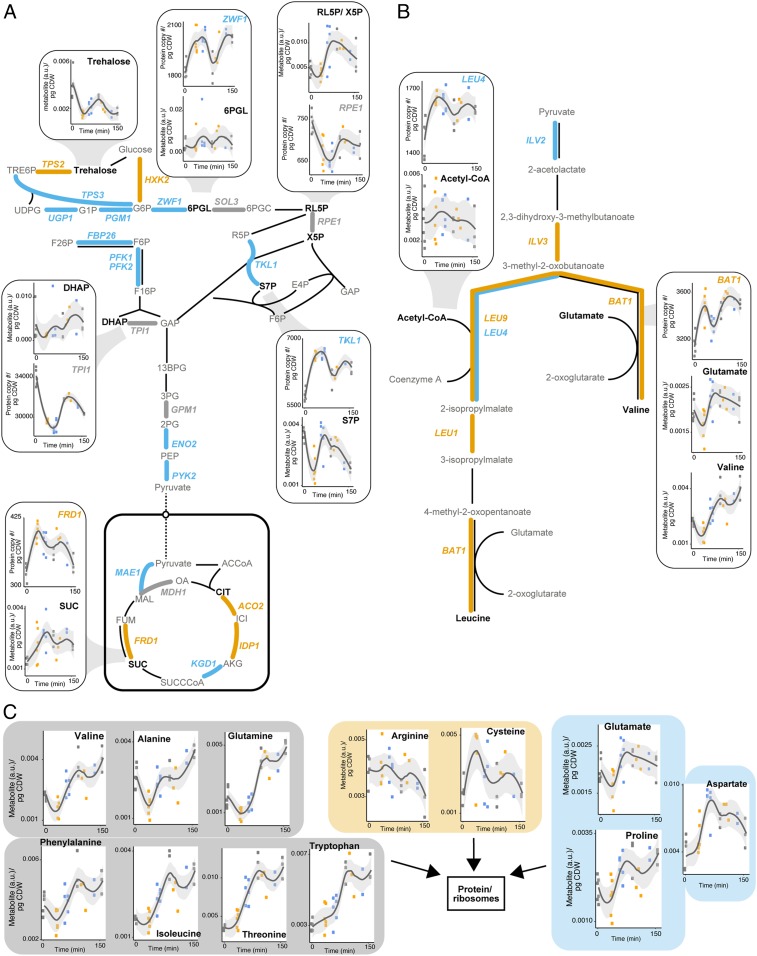
Fig. 5.
Synchronization of central carbon enzyme and metabolite abundance with cell cycle phases. (A) Glycolysis, TCA, and the pentose phosphate pathway with periodic enzyme abundance represented by colored connections between metabolites according to cell cycle phase they demonstrate peak abundance in (G1, gray; S, orange; G2/M, blue). Examples of periodic metabolites with neighboring periodic enzymes are also shown in subpanels. Points reflect individual replicates, with line representing a loess curve fitted to replicate abundance values for each time point, with span for fitting each local regression = 0.6. CI for regression line is 95%. (B) As in A but for the branched chain amino acid biosynthetic pathway. (C) Amino acid abundance grouped according to the cell cycle phase where each amino acid demonstrates peak abundance. a.u., arbitrary units; pg CDW, picogram of cell dry weight.

