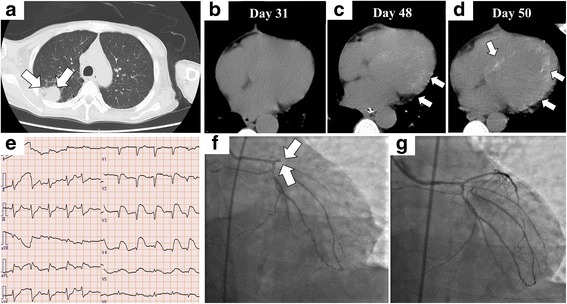
Fig. 4.

Imaging and assessments after treatment. a Computed tomography (CT) images of the chest on day 50. Pleural effusion resolved, but a mass lesion (arrows) is newly observed. b–d CT images of the heart on days 31, 48, and 50. Scattered appearance of high intensity is gradually seen in the cardiac wall. CT performed on day 31 shows no remarkable finding in the myocardium. However, high intensity gradually became apparent on CT images obtained on days 48 and 50 (arrows). e–g Electrocardiogram performed after recovery of spontaneous circulation and coronary angiography (CAG) results on day 50. e ST elevations are observed at leads V2–5 and aVL. Reciprocal changes are observed at leads I, II, and aVF on electrocardiography. f CAG shows complete occlusion of the left descending coronary artery (arrows). g After percutaneous old balloon angioplasty, reperfusion of blood flow is achieved
