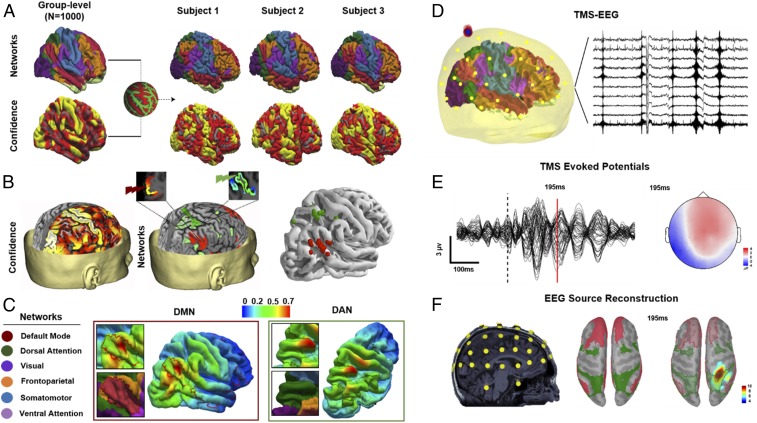
Fig. 1.
Details of individual MRI-guided TMS target selection. (A) Group-averaged functional cortical atlases (n = 1,000) consisting of seven networks (85) were first projected onto individualized cortical surface based on confidence map weights for each network (individual variability in projected confidence maps for three representative subjects is shown). (B) Individualized target coordinates were then determined based on voxels (Left) with the highest confidence in the angular gyrus and superior parietal gyrus for stimulation of the DMN and DAN, respectively (Middle). TMS was performed targeting the DMN (red) and DAN (green), based on confidence maps of RSNs warped onto individual MRI space (Right). (C) The E-field maps were normalized by the maximum E field for each stimulation and for each subject, and then mapped to the fsaverage common template and averaged across subjects for the purpose of visualization. (D) EEG data were also collected simultaneously to TMS. (E) Representative TEPs of all EEG channels after preprocessing, with the topography of sample TEP peak corresponding to brain activity 195 ms after TMS. (F) For source reconstruction of TEPs, digitized EEG channel locations along with anatomical landmarks were registered onto individual MRI space (Left). Forward and inverse modeling of EEG sources were then computed using symmetric boundary element method for forward modeling and minimum norm estimate MNE method for inverse modeling. Resulting EEG source activations were projected onto individual surface space. Confidence maps of DAN (green) and DMN (red) were then projected onto individual surface space (Middle), and used as ROIs to extract baseline normalized (pre-TMS) TMS-EEG source activations (Right).

