Fig. 4.
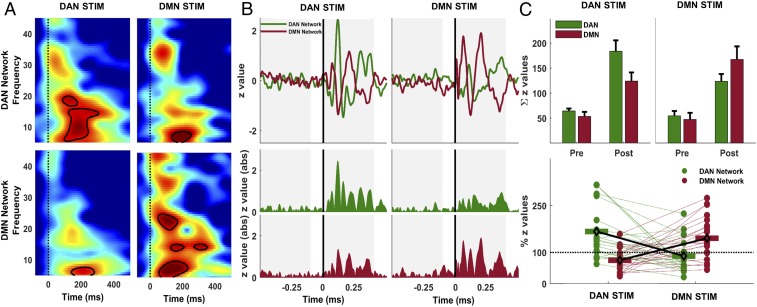
Time−frequency responses and propagation of network activations in source space. (A) Time−frequency distribution of ERSPs following stimulation of DAN and DMN in each network. Group-averaged ERSPs for DAN network response are shown following DAN (Upper Left) and DMN (Upper Right) stimulation. DMN responses are shown in the same order (Lower). Vertical dashed lines indicate TMS pulse, and contour lines show significant clusters (P < 0.01) in each panel compared to baseline. (B) Normalized average MNE current density time series in DAN (solid green line) and DMN (solid red line) maps following TMS of DAN and DMN targets are shown (Upper). Colored regions represent rectified current density amplitudes (Lower). Gray shaded regions show 400-ms time windows used to compute area under the curve in each network map for each stimulation. (C) Colored bars in Upper show group-averaged values with SEs in each network map before (Pre) and after (Post) TMS of DAN (green bars) and DMN (red bars). Lower shows individual Post-TMS cortical activation values expressed as the ratio of total cortical activity in the stimulated network relative to the nonstimulated network map. For instance, in the case of DAN stimulation (green dots), individual values show the ratio of z-score sums in the DAN map relative to z-score sums in the DMN map for each subject. Individual trends for the total amount of cortical activity in each network map are shown with colored dotted lines connecting each subject’s ratio scores across stimulation conditions.

