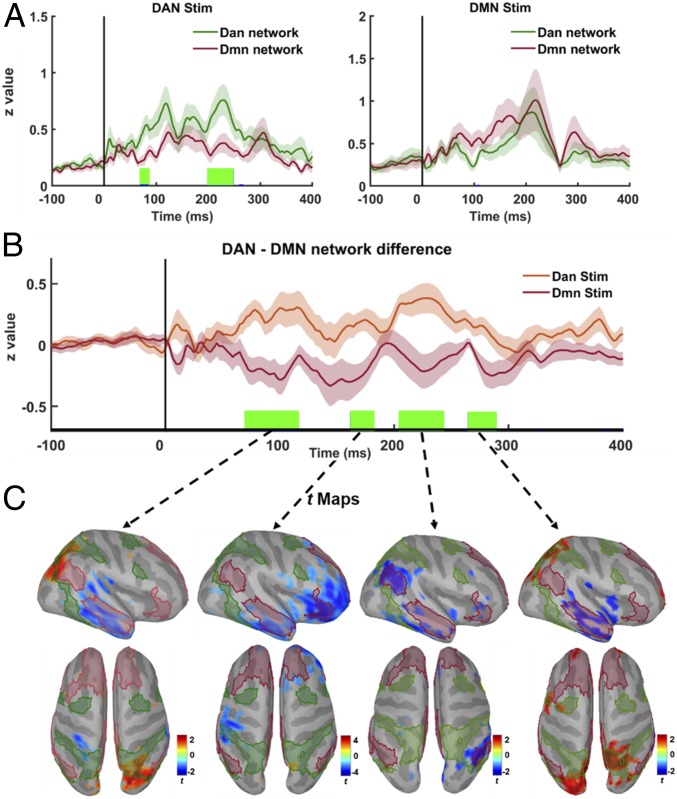
Fig. 5.
Temporal dynamics of TMS-induced network interactions. (A) Comparison of group-averaged time series for each network across stimulation conditions. Solid colored lines show network-level responses for DAN (dark green) and DMN (dark red) averaged across subject and stimulation conditions (DAN: Right; DMN: Left), while shaded regions reflect variation with SE of measurements. Vertical green lines over the x axis show significant time points that survive after cluster-based permutations (P < 0.05). (B) Differences in network-level responses computed by subtracting DAN from DMN current density time series for each subject (n = 21) across stimulation conditions (DAN: orange; DMN: dark red; with shaded regions showing variability in each stimulation condition as SE). Vertical green lines over the x axis show significant time points that survive after cluster-based permutations (P < 0.05). (C) Significant t maps (P < 0.05) averaged over significant time windows in B (green vertical lines) showing differences across the cortex between two stimulation conditions. Higher t values (red) show vertices with significantly higher activity following DAN stimulation, while lower t values (blue) show vertices with significantly higher activity following DMN stimulation.

