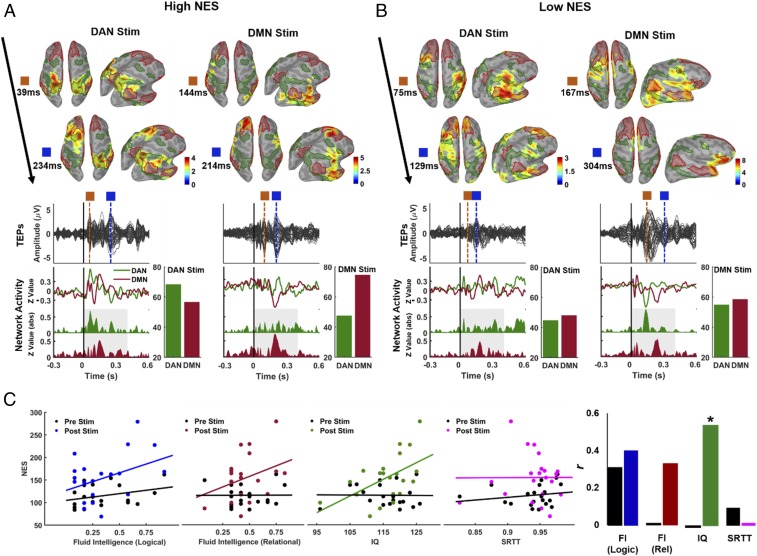
Fig. 7.
Relationships between TMS-induced network activation and cognitive performance. (A and B) Spatiotemporal dynamics of reconstructed EEG sources at selected time points (surface images), corresponding TEPs (solid black lines for each EEG channel), current density time series (colored solid lines), and rectified current density amplitudes with the total amount of electrocortical activity (z-score sums) in each network ROI (colored bars) for two representative subjects with (A) a high NES index (see Methods for details) and (B) a low NES index. (C) Scatterplots with regression lines show correlation trends between individual NES scores and cognitive performance at fluid intelligence (Left), IQ (Middle), and SRTT (Right). Black dots/lines show NES index computed before TMS, representing spontaneous network-to-network interplay, while colored dots/lines show NES index computed after perturbation via TMS. Bar plots also show the direction and magnitude of bivariate Pearson correlations (r); *P < 0.05.

