
Figure 3.
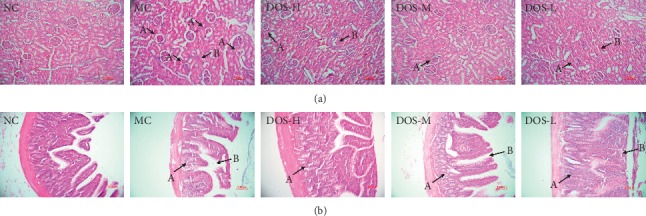
Effect of DOS on kidney and intestinal histopathology of rats (×200). (a) Kidney tissue pictures: A—glomerular atrophy; B—renal interstitial inflammation. (b) Intestinal tissue pictures: A—decreased number of goblet cells in the intestinal; B—intestinal epithelial cells. NC—normal control; MC—model control; DOS-L—low dose of DOS (3.45 g/kg body weight); DOS-M—medium dose of DOS (6.90 g/kg body weight); DOS-H—high dose of DOS (13.80 g/kg body weight). n = 8–10.