
Figure 5.
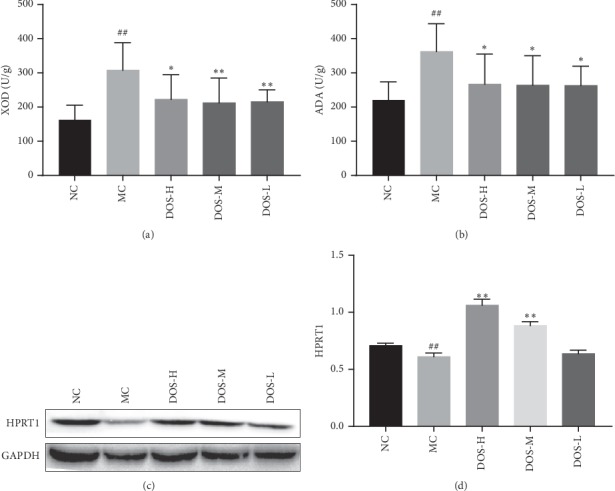
Effect of DOS on UA production. (a) Liver XOD content. (b) Liver ADA content. (c) HPRT1 protein band. (d) HPRT1 protein OD value. NC—normal control; MC—model control; DOS-L—low dose of DOS (3.45 g/kg body weight); DOS-M—medium dose of DOS (6.90 g/kg body weight); DOS-H—high dose of DOS (13.80 g/kg body weight). The data were expressed as mean ± SD of 8–10 rats in each group. #P < 0.05; ##P < 0.01, compared with normal control group; ∗P < 0.05; ∗∗P < 0.01, compared with model control group.