
Figure 3.
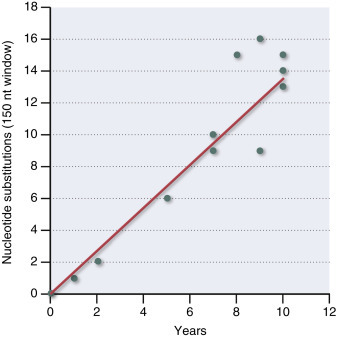
Deriving the molecular clock, the substitutions per nucleotide per year, in a host population. In this instance, a wild strain of poliovirus was introduced into a population and isolates were available over a 10-year time period. For each isolate, the number of nucleotide substitutions (from the original introduced strain) was plotted against the date of the isolate, to determine the substitution rate (substitutions per 150 nucleotides per year).
After Kew et al. (1995).