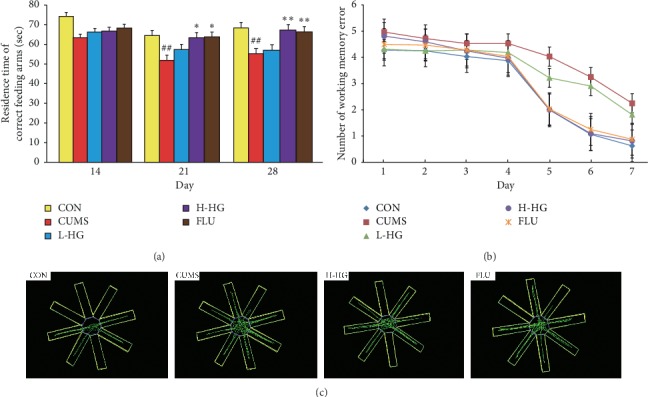
Figure 4.

Effects of HG on mouse behavioral evaluated parameters in RAM. Residence time in the correct feeding arms (a), number of working memory errors (b), and graphic representation of the RAM movement (c). All values are expressed as the mean ± SEM (n = 8). ∗p < 0.05 and ∗∗p < 0.01 compared to the CUMS group; #p < 0.05 and ##p < 0.01 relative to the CON group.
