Figure 8.

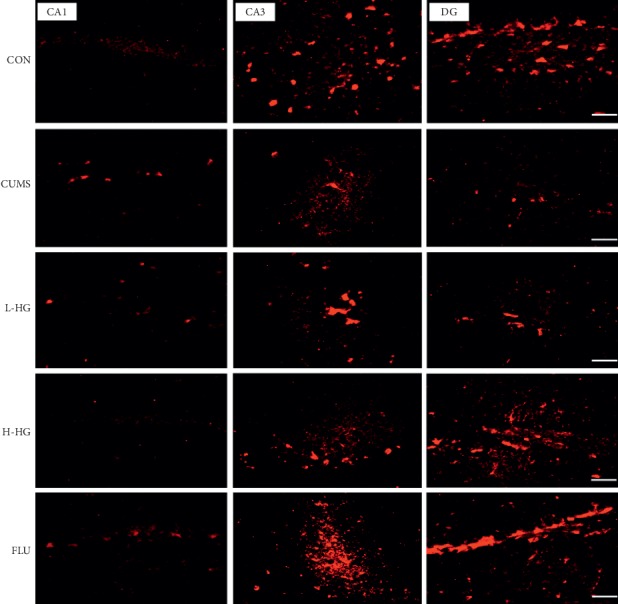
Representative immunohistofluorescent images of NCAM in the hippocampal CA1, CA3, and DG regions. Scale bar shows 200 μm.

Representative immunohistofluorescent images of NCAM in the hippocampal CA1, CA3, and DG regions. Scale bar shows 200 μm.