
Figure 9.
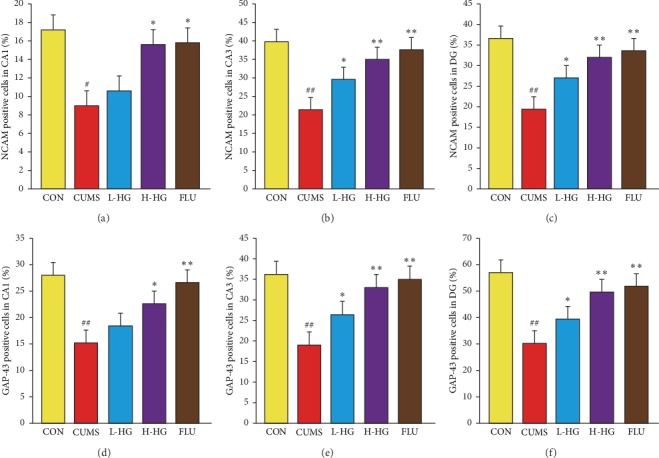
Results of immunohistofluorescent (IHF) analysis on NCAM and GAP-43 protein expression. The percent of NCAM-positive cells in the hippocampal CA1, CA3, and DG regions (a)–(c). The percent of GAP-43-positive cells in the hippocampal CA1, CA3, and DG regions (d)–(f). All values are expressed as the mean ± SEM (n = 5). ∗p < 0.05 and ∗∗p < 0.01 compared to the CUMS group; #p < 0.05 and ##p < 0.01 compared to the CON group.