Fig. 2.
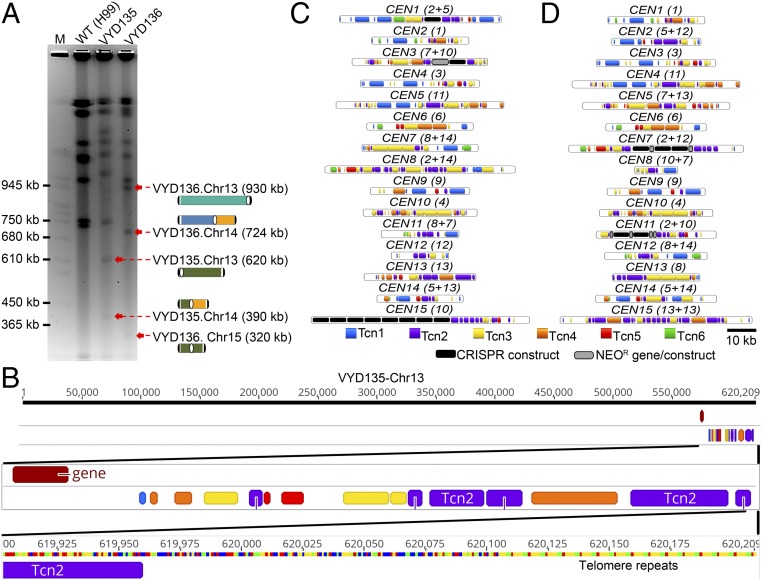
Sequence analysis of new centromeres and telomeres. (A) PFGE ethidium bromide (EtBr) staining showing bands for newly generated short chromosomes and new telocentric chromosomes. M represents S. cerevisiae chromosomes. (B) Chromosome map of one of the newly formed telomeres showing the presence of telomere sequence repeats next to Tcn2 elements present in the centromere. (C and D) Maps showing the distribution of retrotransposons, along with the integration of foreign sequences from CRISPR/Cas9 and the neomycin resistance gene (NEOR), in the centromeres of VYD135 (C) and VYD136 (D). Numbers in brackets next to CEN numbers represent the wild-type CEN numbers that rearranged to form new centromeres.

