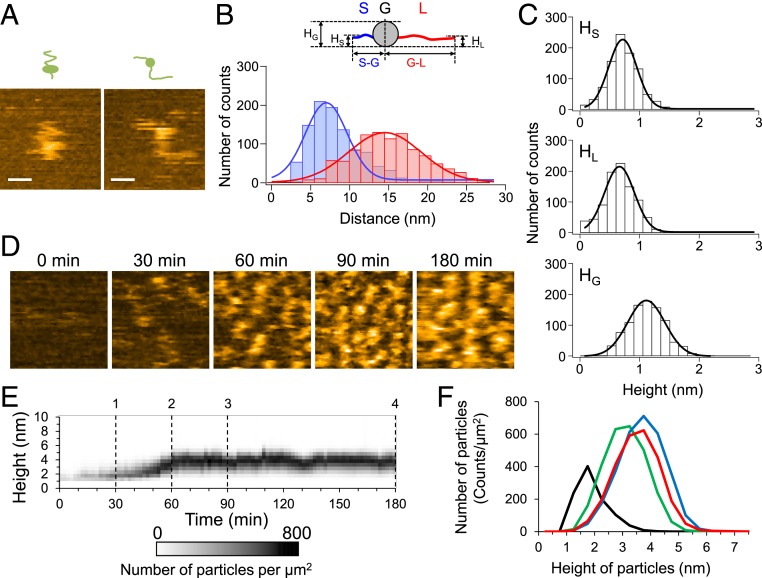
Fig. 1.
Structure of Sup35NM monomer and dynamics of oligomer formation. (A) Two representative HS-AFM images of monomeric Sup35NM molecules deposited on mica immediately after denaturant dilution. (Bars, 15 nm; Z-scale, 2.5 nm; imaging rate, 20 fps.) (B) Distributions of end-to-end distance of the shorter (S-G; blue) and longer (G-L; red) tails extending from the globular part. The corresponding blue and red lines indicate most probable Gaussian fitting obtained with 7.0 ± 3.8 nm and 14.5 ± 6.6 nm for mean distance ± SD. (Inset) Schematic of Sup35NM monomer containing two flexible tails and one globular part. HG, HS, and HL represent the heights of the globular part, shorter tail, and longer tail, respectively. (C) Height distributions of the shorter (HS) and longer (HL) tails and the globular part (HG). The corresponding solid lines indicate most probable Gaussian fitting obtained with 0.64 ± 0.33 nm, 0.59 ± 0.35 nm, and 1.04 ± 0.44 nm for mean height ± SD (D) Representative HS-AFM images showing Sup35NM oligomer formation at the indicated times after reaction initiation. (Z-scale, 5 nm; image size, 100 × 100 nm; imaging rate, 5 fps.) (E) Time course of height distribution of Sup35NM particles. (F) Height histograms of Sup35NM monomers/oligomers at 30- (black), 60- (green), 90- (blue), and 180-min (red) incubation times corresponding to dashed lines 1, 2, 3, and 4 in E.

