Fig. 4.
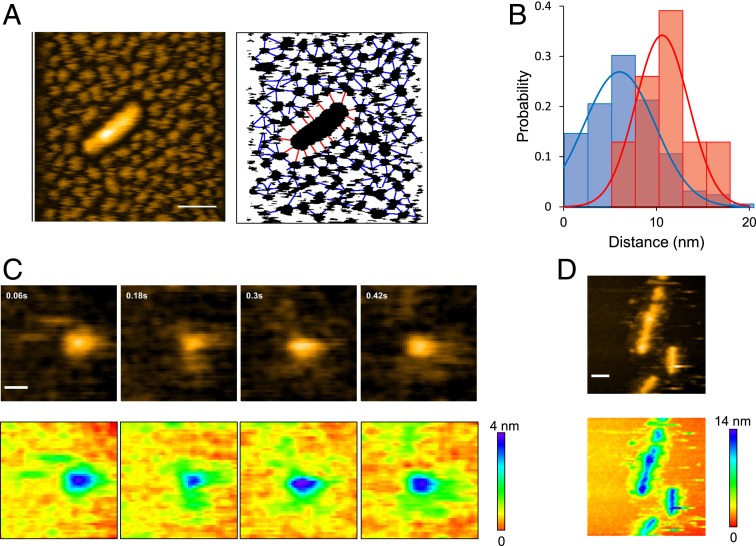
Gap between interoligomers and fibril-oligomers. (A, Left), HS-AFM image showing a Sup35NM fibril densely surrounded by Sup35NM oligomers. (Z-scale, 15 nm; bar, 50 nm; imaging rate, 0.2 fps.) (A, Right), Binarized image corresponding to the image on the Left, together with lines connecting neighboring oligomers (blue) and those connecting the fibril and surrounding oligomers (red). (B) Distributions (bars) and Gaussian fits (lines) of the gap distances between neighboring oligomers (blue) and between the fibril and its surrounding oligomers (red) shown in A, Right. The Gaussian fits were obtained with 6.0 ± 3.8 nm and 10.6 ± 2.9 nm for the interoligomer and the fibril-oligomer distances, respectively. The single-Gaussian distributions are statistically significant (P < 5 × 10⁻⁶ by t test analysis). (C, Upper), HS-AFM images of a Sup35NM oligomer; Sup35NM concentration, 10 nM. (Image size, 50 nm × 50 nm; imaging rate, 16.7 fps; Z-scale, 4 nm; bar, 10 nm.) (C, Lower), Height displays in rainbow color for the images shown in C, Upper. (D, Upper) HS-AFM image of Sup35NM fibrils with some structures extending from the lateral side. (Image size, 200 nm × 200 nm; imaging rate, 1 fps; Z-scale, 14 nm; bar, 30 nm.) (D, Lower), Height display in rainbow color for the HS-AFM image shown in D, Upper.

