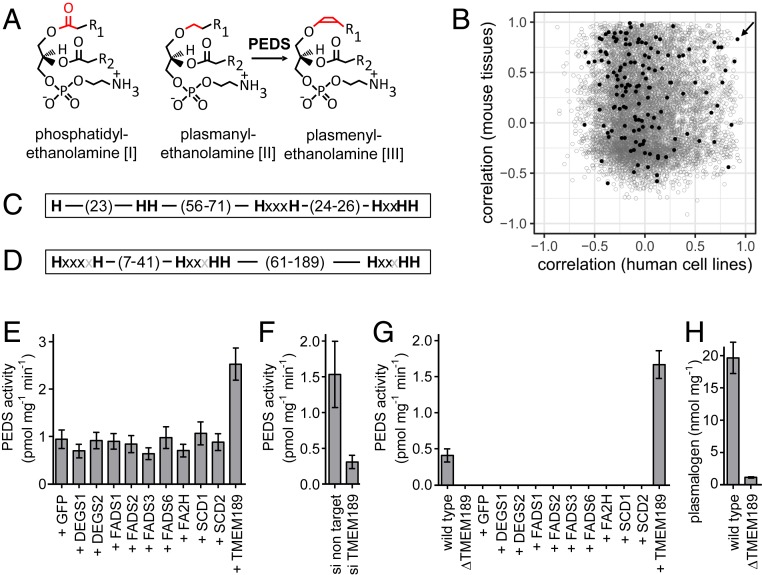
Fig. 1.
PEDS gene identification. (A) Formulas of phosphatidylethanolamine [I], plasmanylethanolamine [II], and plasmenylethanolamine [III], which differ in their bonding type at sn1 (red). The PEDS reaction that generates plasmalogens by introduction of the 1-O-alk-1′-enyl double bond is indicated by an arrow from [II] to [III]. R1 and R2 denote the typical hydrocarbon linear side chains of mammalian lipids comprising (in addition to the two side chain carbons shown in the formula) typically 14 or 16 carbon atoms and zero or one double bond (R1) and approximately 14 to 22 carbon atoms and one to six double bonds (R2). (B) Pearson correlation coefficients of PEDS enzymatic activities (22) with normalized mRNA sequence counts for 7,382 genes commonly expressed in cells or tissues with PEDS activity downloaded from NCBI GEO datasets for seven mouse tissues (y-axis) and 11 human cell lines (x-axis). Black solid circles, genes with gene symbols with Tm as the first two letters, which are mostly transmembrane proteins with unknown function; gray open circles, other genes. The arrow indicates TMEM189. (C) Schematic representation of the conserved histidines deduced from a sequence alignment of the 10 most diverse members of the pfam10520 protein family as displayed in the NCBI conserved domain database (CCD) (43). (D) Schematic representation of the classical eight-histidine motif of stearoyl-CoA desaturase and related desaturases (23). (E) PEDS activities of human HEK293T cells at 48 h posttransfection with selected expression plasmids for desaturase and hydroxylase proteins compared with a TMEM189 protein expression plasmid. GFP (green fluorescent protein) served as a transfection efficiency control. Data are mean ± SEM of four independent experiments. (F) PEDS activities in human A431 cells treated for 72 h with siRNA pools. Data are mean ± SEM of five independent experiments. (G) PEDS activities in WT HAP1 cells compared with TMEM189-deficient HAP1 cells (∆TMEM189) at 48 h posttransfection with expression plasmids for GFP, for selected desaturase and hydroxylase proteins, and for TMEM189 protein. Data are mean ± SEM for three independent experiments. (H) Plasmalogen content of WT HAP1 cells compared with TMEM189-deficient HAP1 cells. Data are mean ± SEM for three independent experiments.

