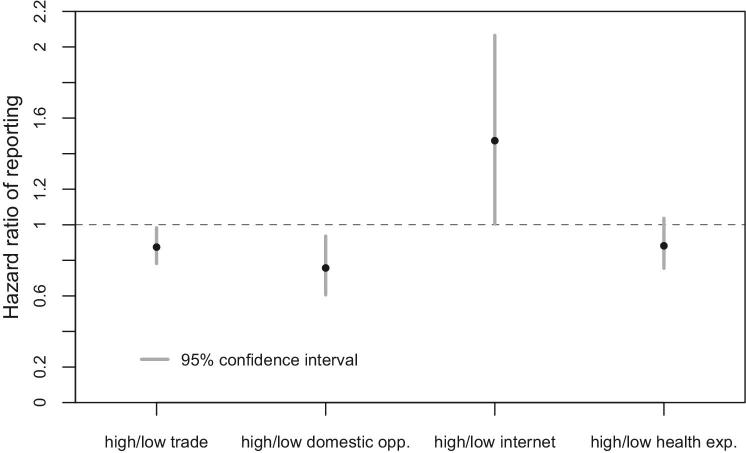
Figure 1.
Ratios of simulated hazard rates of reporting for states with high trade exposure to those with low exposure, states facing domestic political opposition to those not facing opposition, states with high internet coverage to those with low coverage, and states with high health spending to those with low spending. In the case of domestic political opposition, “low” and “high” refer to 0 and 1. For all of the other variables, “low” and “high” refer to the first and third quartiles.

