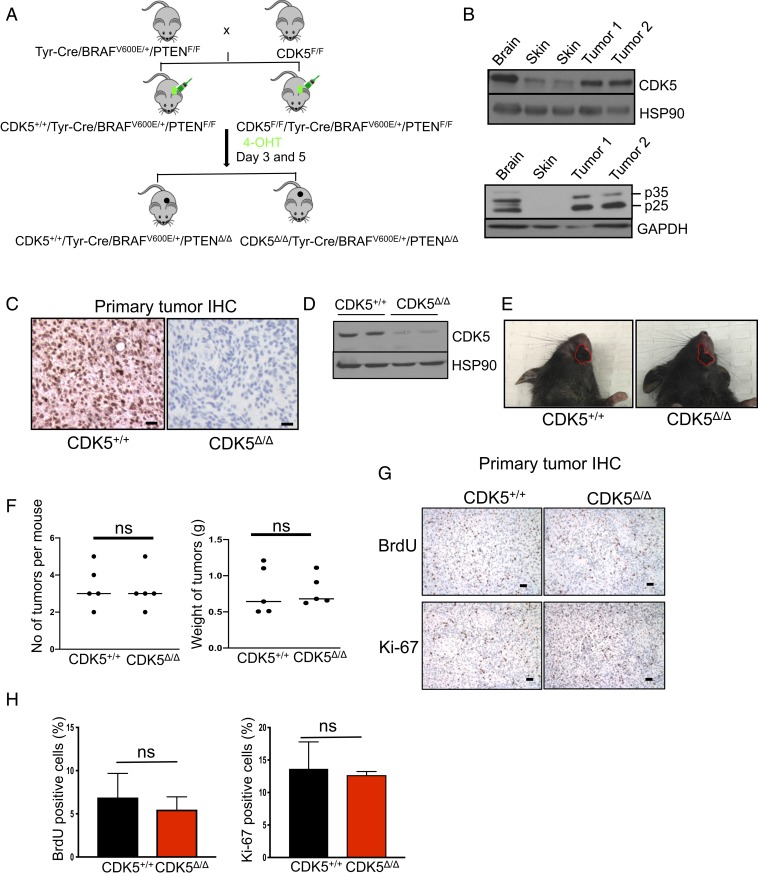
Fig. 1.
Analyses of mouse melanoma tumors. (A) Schematic representation of the crosses to generate mice bearing CDK5+/+/Tyr-Cre/BRAFV600E/+/PTENΔ/Δ and CDK5Δ/Δ/Tyr-Cre/BRAFV600E/+/PTENΔ/Δ tumors. (B) Immunoblotting of tumor lysates for CDK5 (Upper) and p35 (Lower). p25 denotes proteolytically cleaved p35 species. Adjacent normal skin and brain (the latter as a positive control) were also analyzed. Immunoblotting for HSP90 and GAPDH was used as a loading control (n = 2). (C) Immunohistochemistry (IHC) staining of tumor sections with an anti-CDK5 antibody. (Scale bars, 50 μm.) (D) Immunoblotting of tumor lysates for CDK5 and HSP90 (loading control) (n = 3). (E) Examples of skin tumors (denoted by red contours) arising in CDK5+/+ and CDK5F/F mice. (F) Quantification of the number of tumors per mouse and total tumor weight per mouse in CDK5+/+ and CDK5F/F animals (n = 5 mice/group). ns, not significant; unpaired t test. (G) IHC staining of tumors for BrdU (Upper), or Ki-67 (Lower) to mark proliferating cells. (H) Quantification of the fractions of BrdU- or Ki-67–positive cells in CDK5+/+ and CDK5Δ/Δ tumors (n = 5 mice/group). Shown are mean values ± SD (Right, unpaired t test; Left, unpaired t test with Welch’s correction).

