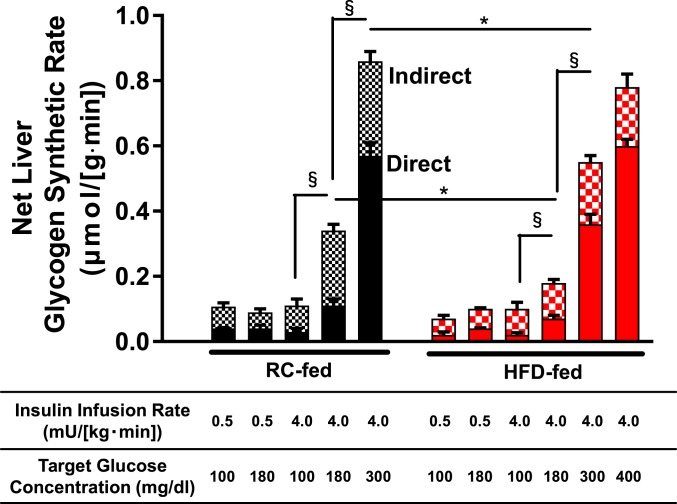
Fig. 1.
Net liver glycogen synthetic rate through both direct and indirect pathways in control and HFD rat models. Rats were fed either RC (black bars) or 3-d HFD (red bars) and subjected to somatostatin pancreatic clamps at the insulin infusion rates and target plasma glucose levels listed below the x axis. Net hepatic glycogen synthetic rates are represented in the bar graph; the solid part of the bar represents direct pathway synthesis and the checkered part of the bar represents indirect pathway synthesis. Data are the mean ± SEM of n = 3 to 13 per group. Statistical analysis reported for comparisons of net glycogen synthetic rates. Within a diet group (RC- or HFD-fed), all groups were compared with all other groups, with statistics by ANOVA with post hoc testing. Between diet groups, rats subject to identical infusion strategies were compared, with statistics by unpaired Student’s t test. *P < 0.05 by unpaired Student’s t test and §P < 0.05 by ANOVA followed by post hoc test.

