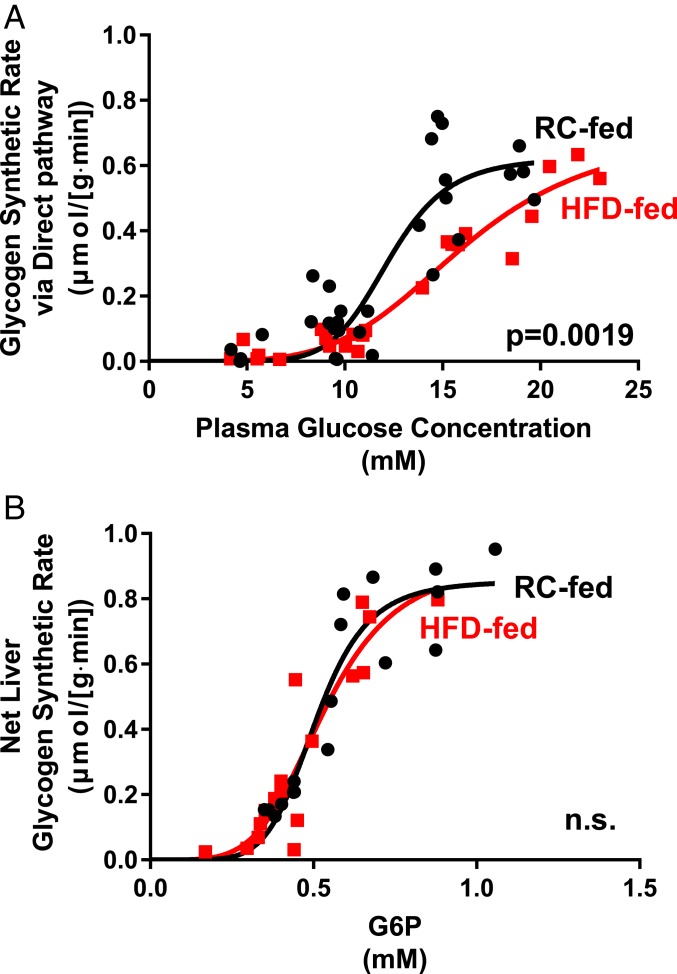
Fig. 2.
The relationship between plasma glucose and direct pathway synthesis is altered while net glycogen synthesis vs. hepatic G6P content is unchanged in hepatic insulin resistance. (A) Under hyperinsulinemic conditions (4 mU/kg⋅min), direct pathway glycogen synthetic rate plotted against plasma glucose concentration. Black circles: RC-fed control rats; red squares: HFD-fed rats. (B) Under hyperinsulinemic conditions (4 mU/kg⋅min), net hepatic glycogen synthesis plotted against hepatic G6P content. Black circles: RC-fed control rats; red squares: HFD-fed rats. Data fit to a sigmoidal model. n.s., not significant.

